
Unlocking Insurance Profits: Which Types Deliver the Strongest Returns?
A comprehensive look at the varying profitability across life, property & casualty, health, and commercial insurance sectors in 2025.
The insurance industry plays a vital role in the economy, providing financial protection against various risks. But how profitable is this business? Profitability isn't uniform across the board; it varies significantly depending on the type of insurance offered. Factors like risk levels, policy duration, regulatory environments, investment performance, and claims frequency all shape the financial success of different insurance lines. Understanding these nuances is key to appreciating the complex financial landscape of the insurance world.
Highlights: Key Profitability Insights
- Life Insurance Leads in Agent Earnings: Often cited as the most profitable for agents due to high first-year commissions (potentially 40-120%) and long-term policy structures that benefit insurers through sustained premiums and investment opportunities.
- P&C Profitability is a Spectrum: Property & Casualty insurance shows wide variation. While the overall sector improved its underwriting profit in 2024, specific lines like mortgage guaranty stand out with exceptionally high returns, while others face more challenges.
- Health Insurance Operates on Slim Margins: Characterized by lower net profit margins (typically 2-6%) due to high healthcare costs, significant regulatory oversight, and claims volatility, making profitability more challenging compared to other sectors.
Deep Dive into Profitability by Insurance Type
Let's explore the profitability profiles of the major insurance categories, drawing on recent industry data and analyses.
Life Insurance: The High-Commission Leader
Life insurance consistently ranks as one of the most profitable insurance types, particularly from an agent's perspective. The primary reasons include:
- Substantial Commissions: Agents often receive a large percentage of the first year's premium, sometimes ranging from 40% up to 120%. This provides a strong incentive for sales.
- Long-Term Policies: Policies like whole life or universal life often span decades. This creates a steady stream of premium income for the insurer and allows ample time for invested premiums (the "float") to generate returns.
- Predictable Payouts (Eventually): While payouts are certain (upon death or policy maturity), the long timeframe allows insurers significant latitude for investment management.
- Growing Niches: Final expense insurance, catering to the costs associated with end-of-life planning, is noted as a particularly profitable niche, driven by aging demographics.
Despite the high earning potential, selling life insurance can be challenging due to the product's nature and the need for significant customer education and trust.
This video explores how insurance companies generate revenue and profit specifically from whole life insurance policies, highlighting the role of premiums and investments.
Property & Casualty (P&C) Insurance: A Diverse Landscape
P&C insurance covers a broad array of risks, from auto accidents and home damage to commercial liability and workers' injuries. Profitability here is highly variable.
Overall P&C Performance
The P&C sector has seen improvements. The industry's combined ratio (a key measure where below 100% indicates underwriting profit) improved significantly from 101.8% in 2023 to a profitable 96.6% in 2024. This suggests insurers are collecting more in premiums than they are paying out in claims and expenses, on average. Record profits ($88 billion) were reported for the P&C industry in 2023, fueled by rate increases that outpaced rising claim costs. Industry-wide return on equity (ROE) is forecast to remain robust, potentially above 10% into 2025.
However, profitability varies greatly depending on the specific line of business:
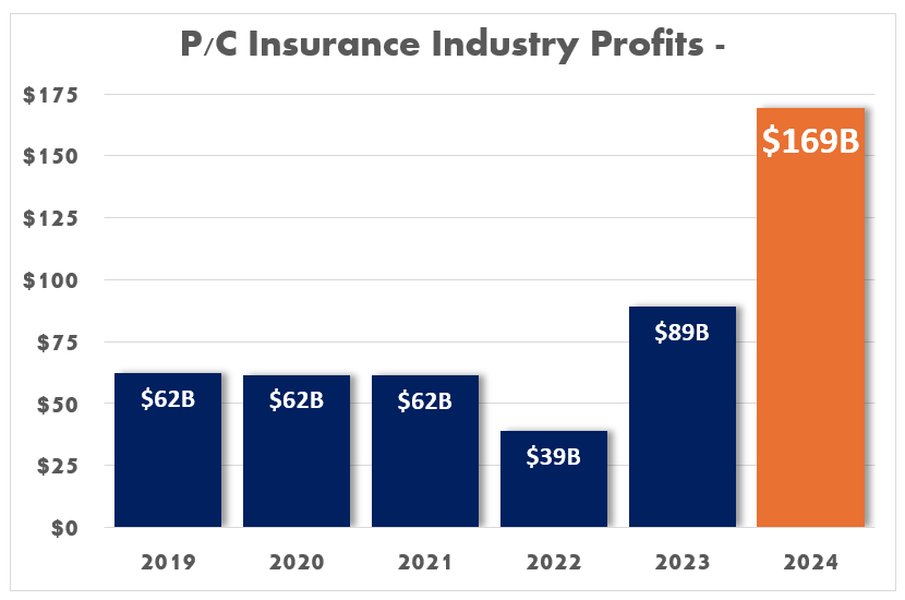
Historical view of Property & Casualty insurance industry net income after taxes, illustrating recent trends towards higher profitability.
Highly Profitable P&C Lines
- Mortgage Guaranty: Consistently identified as the most profitable P&C line, sometimes achieving profit margins (as a percentage of net worth) exceeding 30%. This is often attributed to relatively lower claim frequencies in favorable economic conditions.
- Inland Marine: Covering goods in transit or held by bailees, this line often benefits from specialized underwriting and stable premium levels.
- Fire Insurance: A traditional line that can be profitable with careful risk assessment and pricing.
- Warranty & Workers' Compensation: These lines also frequently appear among the more profitable segments. Workers' compensation, for instance, is projected to see moderate loss cost decreases in 2025, potentially boosting profitability.
Challenging P&C Lines
- Personal Auto: Historically challenging due to competition and claims costs, personal auto insurers have implemented substantial price increases. This is expected to lead to break-even results or underwriting profits in 2024 and 2025.
- Commercial Property & General Liability: These lines can face significant volatility, particularly from large catastrophe events (like hurricanes impacting commercial property) or evolving liability trends. Projections for 2024 indicated worsening combined ratios for these segments compared to 2023.
Health Insurance: Navigating Tight Margins
Health insurance companies typically operate with slimmer profit margins compared to life or P&C insurers. Key characteristics include:
- Low Net Margins: Generally range from 2% to 6%. Recent data points to margins around 3.4%.
- High Costs & Regulation: Rising healthcare costs, administrative expenses (processing claims), and significant regulatory oversight (like the Affordable Care Act in the U.S.) put pressure on profitability.
- Claims Volatility: Fluctuations in illness rates, treatment costs, and utilization impact financial results.
- Investment Income Importance: Like other insurers, health insurers rely on investment income from reserves, which has seen improvement due to higher interest rates, boosting ROE figures recently.

Trends in net profit margins for the U.S. health insurance industry, illustrating the typically narrow margins.
Commercial Insurance: Complexity Meets Profit
This category often overlaps with P&C but focuses specifically on business clients. It includes lines like commercial auto, property, general liability, professional liability (errors & omissions), and workers' compensation tailored for businesses.
- Potential for High Profitability: Can be very lucrative due to larger premium sizes and potentially sophisticated risk management needs.
- Requires Expertise: Underwriting commercial risks is complex and demands deep industry knowledge to price policies accurately.
- Less Commoditized: Often less price-sensitive than personal lines, allowing for potentially better margins for insurers with strong expertise and value propositions.
- Economic Sensitivity: Profitability can be tied to the economic health of the industries being insured.
Key Drivers of Insurance Profitability
Understanding what makes an insurance line profitable involves looking at several interconnected factors:
- Underwriting Profit: The difference between premiums collected and the sum of claims paid and expenses incurred. A combined ratio below 100% signifies an underwriting profit.
- Investment Income: Insurers invest the premiums they receive before needing to pay claims (this pool of funds is called the "float"). Returns on these investments are a critical component of overall profitability, especially for long-tail lines (where claims may take years to settle, like liability) and in higher interest rate environments. Investment returns for non-life insurers were projected to rise from 3.3% in 2023 to 3.7% in 2024 and 3.9% in 2025.
- Pricing Accuracy: Setting premiums that adequately reflect the underlying risk is crucial. This involves sophisticated actuarial analysis.
- Claims Management: Efficiently and fairly handling claims, controlling costs, and preventing fraud impacts the bottom line.
- Operating Expenses: Costs associated with running the business, including agent commissions, salaries, technology, and administrative overhead.
- Catastrophe Losses: Natural disasters (hurricanes, wildfires, floods) can cause significant losses, particularly impacting P&C insurers.
- Regulatory Environment: Regulations can affect pricing, capital requirements, and market conduct, influencing profitability.
- Economic Conditions: Factors like inflation (affecting claim costs) and interest rates (affecting investment income) play a major role.
Comparing Profitability Factors Across Insurance Types
This chart provides a comparative view of key factors influencing profitability across major insurance categories. Scores are illustrative, representing relative potential or impact (1=Low, 10=High) based on general industry characteristics discussed.
As illustrated, Life insurance scores high on commission potential and investment impact but lower on risk volatility. P&C insurance shows significant risk volatility but moderate underwriting potential overall. Health insurance faces high regulatory complexity and lower underwriting margins. Commercial insurance blends relatively high potential across several factors but also involves complexity and volatility.
Insurance Profitability Landscape: A Mindmap View
This mindmap provides a visual overview of the core concepts related to insurance profitability, connecting the different types of insurance to their key drivers and measurement metrics.
(Premiums vs. Claims/Expenses)"] id1b["Investment Income
(From Premiums/Float)"] id1c["Premium Volume & Pricing"] id1d["Claims Costs & Frequency"] id1e["Operating Expenses"] id1f["Regulatory Environment"] id1g["Economic Factors
(Inflation, Interest Rates)"] id2["Measurement Metrics"] id2a["Net Profit Margin"] id2b["Combined Ratio (P&C)"] id2c["Return on Equity (ROE)"] id2d["Agent Commissions"] id3["Profitability by Type"] id3a["Life Insurance"] id3a1["High Commissions"] id3a2["Long-Term Contracts"] id3a3["Final Expense Niche"] id3b["P&C Insurance"] id3b1["Variable Profitability"] id3b2["Mortgage Guaranty (High)"] id3b3["Personal Auto (Improving)"] id3b4["Commercial Lines"] id3b5["Impacted by Catastrophes"] id3c["Health Insurance"] id3c1["Slim Margins (2-6%)"] id3c2["High Regulation"] id3c3["Cost Pressures"] id3d["Commercial Insurance"] id3d1["High Potential (Expertise Needed)"] id3d2["Complex Risks"] id3d3["Larger Premiums"]
The mindmap highlights the central role of underwriting and investments as drivers, the key metrics used for measurement, and the distinct characteristics influencing profitability across the main insurance categories and some notable sub-types.
Summary Table: Profitability at a Glance
This table summarizes the typical profitability characteristics, commission structures, and key influencing factors for major insurance types.
| Insurance Type | Typical Net Profit Margin | Agent Commissions (First Year) | Key Profit Drivers | Relative Profitability | Notes |
|---|---|---|---|---|---|
| Life Insurance | Generally High (Implied by long-term value) | Very High (40-120%) | Long contracts, Investment returns, Premium size, Persistency | Very High | Final expense is a key niche. Considered rewarding but challenging to sell. |
| P&C (Overall) | 2-7% (Average), Higher recent net margins reported (~6.9%) | Moderate (e.g., Auto 10-15%) | Underwriting discipline, Investment returns, Catastrophe risk management, Rate adequacy | Variable | Combined Ratio is a key metric (aim <100%). Industry avg. 96.6% in 2024. |
| - Mortgage Guaranty | Up to ~30% (of net worth) | Varies | Low claims frequency (historically), Specialized market | Exceptionally High | Often the top P&C performer. |
| - Personal Auto | Low Single Digits (Improving) | 10-15% | Price increases vs. Repair costs & Accident rates | Improving | Expected underwriting profit in 2025 after rate hikes. |
| Health Insurance | 2-6% | Lower | Claims volume, Medical cost trends, Regulation, Investment income, Administrative efficiency | Low | Slim margins due to cost pressures and regulatory environment. |
| Commercial Insurance | Often High (with expertise) | Moderate to High | Specialized risk underwriting, Higher premiums, Client relationships, Industry knowledge | High | Complex segment requiring significant expertise for success. |
Frequently Asked Questions (FAQ)
Why is life insurance often considered the most profitable to sell?
Life insurance typically offers agents the highest commission rates, especially in the first year of the policy (often 40-120% of the premium). For insurers, the long duration of many life policies allows substantial time to earn investment income on collected premiums before paying out claims, contributing significantly to overall profitability.
What does the "Combined Ratio" mean for P&C insurance profitability?
The Combined Ratio is a key performance indicator for Property & Casualty (P&C) insurers. It's calculated by adding the Loss Ratio (claims paid + adjustment expenses / premiums earned) and the Expense Ratio (underwriting expenses / premiums written). A ratio below 100% indicates that the insurer is making an underwriting profit (collecting more in premiums than paid out in claims and expenses). A ratio above 100% indicates an underwriting loss. The P&C industry average was 96.6% in 2024, signaling an overall underwriting profit.
How do rising interest rates affect insurance company profits?
Rising interest rates generally benefit insurance companies, particularly those with significant investment portfolios like life and P&C insurers. Insurers invest the premiums they collect ("float") primarily in fixed-income securities (bonds). Higher interest rates mean they can earn greater returns on new investments and reinvested funds. This increased investment income can significantly boost overall profitability, helping to offset underwriting losses or enhance underwriting gains. Recent reports indicate improved ROE projections for insurers in 2024 and 2025, partly driven by higher investment yields.
Which P&C insurance line has been the most profitable recently?
Based on analyses covering recent years (including data leading into 2023/2024), Mortgage Guaranty insurance has consistently ranked as the most profitable line within the Property & Casualty sector. Its profitability, sometimes measured as over 30% return on net worth in certain periods, is often linked to lower-than-expected claim frequencies during times of stable housing markets and economic conditions. Other historically profitable P&C lines include inland marine, fire, warranty, and workers' compensation.
Recommended
- What are the specific factors driving profitability in commercial insurance lines?
- How does reinsurance impact the profitability of primary insurers, especially for catastrophe risk?
- How do the investment strategies differ between life insurance and P&C insurance companies?
- What is the future outlook for health insurance profit margins considering rising costs and potential regulations?
References
Last updated May 6, 2025