
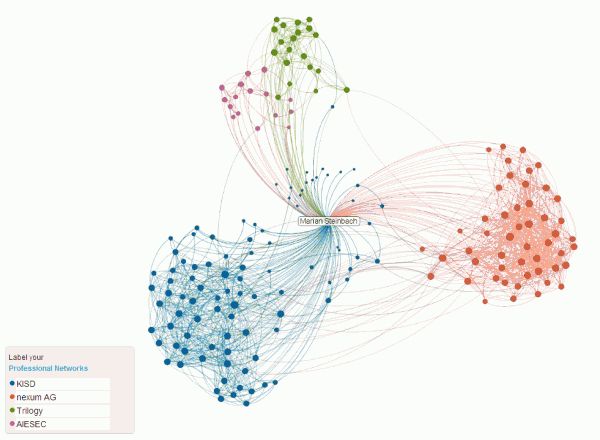
Interactive Network Graph Visualization
Engaging network graph with advanced filtering and dynamic analysis
Highlights
- Dynamic Filtering: Easily filter nodes and edges based on attributes like type, weight, and search terms.
- Multiple Layouts: Switch between force-directed, circular, and grid layouts to view the graph from different perspectives.
- Interactive Elements: Drag nodes, hover for tooltips, and view real-time network statistics.
Overview
This comprehensive HTML example demonstrates how to create an interactive network graph that includes advanced visualizations and filtering options. By leveraging powerful libraries such as D3.js combined with CSS styling and JavaScript, the network graph can be dynamically manipulated to reveal insights and relationships between nodes. The implementation offers interactive dragging of nodes, tooltips for detailed node information, as well as various filtering options that allow you to adjust the visualization based on node type, edge weight, and node search queries.
Detailed Implementation
HTML Structure Setup
The HTML structure sets up the basic containers and controls required for the interactive graph. This includes a dedicated section for the network graph display, filtering controls, a dynamic legend, and network statistical data such as total nodes, total edges, average degree, and network density. The page is styled to ensure that the visualization is both practical and aesthetically appealing.
Key Components:
- Graph Container: An SVG element where the network graph is rendered.
- Filtering Controls: Input elements for node filtering, edge weight adjustment, search queries, layout selection, and node color coding.
- Legend: A dynamic legend that updates based on the selected coloring scheme (e.g., by node type, centrality or degree).
- Network Statistics: Real-time information regarding the network structure is computed and displayed.
HTML, CSS, and JavaScript Code
Below is the full HTML code that incorporates the network graph visualization along with multiple options to filter and analyze the graph data. This solution uses D3.js version 7 for rendering and updating the graph. The code is extensively commented and organized to ensure readability and easy customization.
<!DOCTYPE html>
<html lang="en">
<head>
  <meta charset="UTF-8">
  <meta name="viewport" content="width=device-width, initial-scale=1.0">
  <title>Interactive Network Graph with Advanced Filters</title>
  <style>
    body {
      font-family: Arial, sans-serif;
      margin: 0;
      padding: 20px;
      background-color: #f9f9f9;
    }
    #container {
      max-width: 1400px;
      margin: 0 auto;
      background-color: #fff;
      border-radius: 8px;
      box-shadow: 0 2px 10px rgba(0,0,0,0.1);
      padding: 20px;
    }
    h1, h2 {
      text-align: center;
    }
    h1 {
      margin-bottom: 10px;
    }
    #controls {
      display: flex;
      flex-wrap: wrap;
      gap: 20px;
      margin-bottom: 20px;
      justify-content: center;
      background-color: #eef6f3;
      padding: 15px;
      border-radius: 8px;
    }
    .control-group {
      flex: 1;
      min-width: 220px;
    }
    .control-group label {
      display: block;
      margin-bottom: 5px;
      font-weight: bold;
    }
    .control-group input, .control-group select, .control-group button {
      width: 100%;
      padding: 8px;
      border: 1px solid #ccc;
      border-radius: 4px;
    }
    #graph {
      border: 1px solid #ddd;
      border-radius: 4px;
      height: 600px;
    }
    /* Graph styling using D3.js */
    .node {
      stroke: #fff;
      stroke-width: 1.5px;
    }
    .link {
      stroke: #999;
      stroke-opacity: 0.6;
    }
    .tooltip {
      position: absolute;
      text-align: center;
      width: auto;
      padding: 6px;
      font-size: 13px;
      background: rgba(0, 0, 0, 0.7);
      color: #fff;
      border-radius: 4px;
      pointer-events: none;
      opacity: 0;
    }
    #legend, #stats {
      margin-top: 20px;
      padding: 15px;
      background-color: #eef6f3;
      border-radius: 8px;
    }
  </style>
  <script src="https://d3js.org/d3.v7.min.js"></script>
</head>
<body>
  <div id="container">
    <h1 style="color: #cc9900;">Interactive Network Graph Visualization</h1>
    <div id="controls">
      <div class="control-group">
        <label for="node-filter">Filter Nodes by Type:</label>
        <select id="node-filter">
          <option value="all">All Types</option>
          <option value="type1">Type 1</option>
          <option value="type2">Type 2</option>
          <option value="type3">Type 3</option>
        </select>
      </div>
      <div class="control-group">
        <label for="edge-filter">Filter Edges by Weight:</label>
        <input type="range" id="edge-filter" min="1" max="10" value="1">
        <span id="edge-filter-value">1</span>
      </div>
      <div class="control-group">
        <label for="search">Search Node:</label>
        <input type="text" id="search" placeholder="Enter node name...">
      </div>
      <div class="control-group">
        <label for="layout">Layout Type:</label>
        <select id="layout">
          <option value="force">Force-Directed</option>
          <option value="circular">Circular</option>
          <option value="grid">Grid</option>
        </select>
      </div>
      <div class="control-group">
        <label for="color-by">Color Nodes By:</label>
        <select id="color-by">
          <option value="type">Node Type</option>
          <option value="centrality">Centrality</option>
          <option value="degree">Degree</option>
        </select>
      </div>
      <div class="control-group">
        <button id="reset">Reset Filters</button>
      </div>
    </div>

    <div id="graph"></div>

    <div id="legend">
      <h3 style="color: #388278;">Legend</h3>
      <div id="legend-content">
        <div class="legend-item"><span class="legend-color" style="display:inline-block; width:15px; height:15px; background-color:#1f77b4; border-radius:50%; margin-right:5px;"></span>Type 1</div>
        <div class="legend-item" style="margin-left:10px;"><span class="legend-color" style="display:inline-block; width:15px; height:15px; background-color:#ff7f0e; border-radius:50%; margin-right:5px;"></span>Type 2</div>
        <div class="legend-item" style="margin-left:10px;"><span class="legend-color" style="display:inline-block; width:15px; height:15px; background-color:#2ca02c; border-radius:50%; margin-right:5px;"></span>Type 3</div>
      </div>
    </div>

    <div id="stats">
      <h3 style="color: #388278;">Network Statistics</h3>
      <p>Total Nodes: <span id="total-nodes">0</span></p>
      <p>Total Edges: <span id="total-edges">0</span></p>
      <p>Average Degree: <span id="avg-degree">0</span></p>
      <p>Network Density: <span id="density">0</span></p>
    </div>
  </div>

  <script>
    // Sample data for the network graph using nodes and links
    const data = {
      nodes: [
        { id: 1, name: "Node 1", type: "type1", size: 10, centrality: 0.8 },
        { id: 2, name: "Node 2", type: "type1", size: 8, centrality: 0.6 },
        { id: 3, name: "Node 3", type: "type2", size: 12, centrality: 0.9 },
        { id: 4, name: "Node 4", type: "type2", size: 7, centrality: 0.5 },
        { id: 5, name: "Node 5", type: "type3", size: 9, centrality: 0.7 },
        { id: 6, name: "Node 6", type: "type3", size: 11, centrality: 0.85 },
        { id: 7, name: "Node 7", type: "type1", size: 6, centrality: 0.4 },
        { id: 8, name: "Node 8", type: "type2", size: 10, centrality: 0.75 },
        { id: 9, name: "Node 9", type: "type3", size: 8, centrality: 0.65 },
        { id: 10, name: "Node 10", type: "type1", size: 9, centrality: 0.7 }
      ],
      links: [
        { source: 1, target: 2, weight: 5 },
        { source: 1, target: 3, weight: 7 },
        { source: 2, target: 4, weight: 3 },
        { source: 2, target: 5, weight: 8 },
        { source: 3, target: 5, weight: 6 },
        { source: 4, target: 6, weight: 2 },
        { source: 5, target: 6, weight: 9 },
        { source: 6, target: 7, weight: 4 },
        { source: 7, target: 8, weight: 7 },
        { source: 8, target: 9, weight: 5 },
        { source: 9, target: 10, weight: 8 },
        { source: 10, target: 1, weight: 6 },
        { source: 3, target: 8, weight: 3 },
        { source: 5, target: 9, weight: 4 },
        { source: 2, target: 7, weight: 2 }
      ]
    };

    // Deep copy to hold our filtered data
    let filteredData = JSON.parse(JSON.stringify(data));

    // Calculate degrees for each node
    const calculateDegrees = () => {
      const degreeMap = {};
      data.nodes.forEach(node => {
        degreeMap[node.id] = 0;
      });
      data.links.forEach(link => {
        degreeMap[link.source] = (degreeMap[link.source] || 0) + 1;
        degreeMap[link.target] = (degreeMap[link.target] || 0) + 1;
      });
      data.nodes.forEach(node => {
        node.degree = degreeMap[node.id] || 0;
      });
    };
    calculateDegrees();

    // Set up SVG and simulation dimensions
    const graphContainer = document.getElementById('graph');
    const width = graphContainer.clientWidth;
    const height = 600;

    const svg = d3.select('#graph')
                  .append('svg')
                  .attr('width', width)
                  .attr('height', height);

    // Create a tooltip for graph interactions
    const tooltip = d3.select('body')
                      .append('div')
                      .attr('class', 'tooltip');

    // Define color scales for node attributes
    const typeColorScale = d3.scaleOrdinal()
                             .domain(['type1', 'type2', 'type3'])
                             .range(['#1f77b4', '#ff7f0e', '#2ca02c']);
    const centralityColorScale = d3.scaleSequential()
                                   .domain([0, 1])
                                   .interpolator(d3.interpolateViridis);
    const degreeColorScale = d3.scaleSequential()
                               .domain([0, d3.max(data.nodes, d => d.degree)])
                               .interpolator(d3.interpolateReds);

    // Initialize force simulation
    let simulation = d3.forceSimulation()
                       .force('link', d3.forceLink().id(d => d.id))
                       .force('charge', d3.forceManyBody().strength(-200))
                       .force('center', d3.forceCenter(width / 2, height / 2));

    // Create groups for links and nodes
    const linkGroup = svg.append('g').attr('class', 'links');
    const nodeGroup = svg.append('g').attr('class', 'nodes');

    // Function to update the visualization based on filters and layout
    const updateVisualization = () => {
      // Get filter parameters from controls
      const nodeFilter = document.getElementById('node-filter').value;
      const edgeWeightFilter = parseInt(document.getElementById('edge-filter').value);
      const searchTerm = document.getElementById('search').value.toLowerCase();
      const layout = document.getElementById('layout').value;
      const colorBy = document.getElementById('color-by').value;

      // Filter nodes based on type and search term
      let filteredNodes = data.nodes;
      if (nodeFilter !== 'all') {
        filteredNodes = filteredNodes.filter(node => node.type === nodeFilter);
      }
      if (searchTerm) {
        filteredNodes = filteredNodes.filter(node => node.name.toLowerCase().includes(searchTerm));
      }

      // Create a set of valid node IDs
      const nodeIds = new Set(filteredNodes.map(node => node.id));

      // Filter links based on node membership and edge weight
      let filteredLinks = data.links.filter(link =>
        nodeIds.has(link.source) && nodeIds.has(link.target) && link.weight >= edgeWeightFilter
      );

      // Update filteredData
      filteredData = {
        nodes: filteredNodes,
        links: filteredLinks
      };

      // Update network statistical information
      document.getElementById('total-nodes').textContent = filteredNodes.length;
      document.getElementById('total-edges').textContent = filteredLinks.length;
      const avgDegree = filteredLinks.length * 2 / (filteredNodes.length || 1);
      document.getElementById('avg-degree').textContent = avgDegree.toFixed(2);
      const density = filteredLinks.length / ((filteredNodes.length * (filteredNodes.length - 1) / 2) || 1);
      document.getElementById('density').textContent = density.toFixed(3);

      // DATA JOIN for links
      const linkSelection = linkGroup.selectAll('line')
                                     .data(filteredLinks, d => d.source + '-' + d.target);
      linkSelection.exit().remove();
      const linkEnter = linkSelection.enter()
                                     .append('line')
                                     .attr('class', 'link')
                                     .attr('stroke-width', d => Math.sqrt(d.weight));
      linkEnter.merge(linkSelection);

      // DATA JOIN for nodes
      const nodeSelection = nodeGroup.selectAll('circle')
                                     .data(filteredNodes, d => d.id);
      nodeSelection.exit().remove();
      const nodeEnter = nodeSelection.enter()
                                     .append('circle')
                                     .attr('class', 'node')
                                     .attr('r', d => d.size)
                                     .attr('fill', d => {
                                       if (colorBy === 'type') return typeColorScale(d.type);
                                       if (colorBy === 'centrality') return centralityColorScale(d.centrality);
                                       if (colorBy === 'degree') return degreeColorScale(d.degree);
                                     })
                                     .call(d3.drag()
                                       .on('start', dragstarted)
                                       .on('drag', dragged)
                                       .on('end', dragended))
                                     .on('mouseover', (event, d) => {
                                       tooltip.transition().duration(200).style('opacity', 0.85);
                                       tooltip.html('<strong>' + d.name + '</strong><br>Type: ' + d.type +
                                                    '<br>Degree: ' + d.degree + '<br>Centrality: ' + d.centrality)
                                              .style('left', (event.pageX + 10) + 'px')
                                              .style('top', (event.pageY - 28) + 'px');
                                     })
                                     .on('mouseout', () => {
                                       tooltip.transition().duration(500).style('opacity', 0);
                                     });
      nodeEnter.merge(nodeSelection);

      // Apply node layout adjustments based on selection
      if (layout === 'circular') {
        const radius = Math.min(width, height) / 2 - 50;
        filteredNodes.forEach((node, i) => {
          const angle = (i / filteredNodes.length) * 2 * Math.PI;
          node.x = width / 2 + radius * Math.cos(angle);
          node.y = height / 2 + radius * Math.sin(angle);
          node.fx = node.x;
          node.fy = node.y;
        });
      } else if (layout === 'grid') {
        const nodeCount = filteredNodes.length;
        const cols = Math.ceil(Math.sqrt(nodeCount));
        const rows = Math.ceil(nodeCount / cols);
        const gridWidth = width - 100;
        const gridHeight = height - 100;
        const cellWidth = gridWidth / cols;
        const cellHeight = gridHeight / rows;
        filteredNodes.forEach((node, i) => {
          const col = i % cols;
          const row = Math.floor(i / cols);
          node.x = 50 + col * cellWidth + cellWidth / 2;
          node.y = 50 + row * cellHeight + cellHeight / 2;
          node.fx = node.x;
          node.fy = node.y;
        });
      } else {
        // Force-directed, remove fixed positions
        filteredNodes.forEach(node => {
          node.fx = null;
          node.fy = null;
        });
      }

      // Update simulation with new nodes and links
      simulation.nodes(filteredNodes).on('tick', ticked);
      simulation.force('link').links(filteredLinks);
      simulation.alpha(1).restart();

      // Update the legend dynamically
      if (colorBy === 'type') {
        document.getElementById('legend-content').innerHTML =
          '<div class="legend-item"><span class="legend-color" style="display:inline-block;width:15px;height:15px;background-color:#1f77b4;border-radius:50%;margin-right:5px;"></span>Type 1</div>' +
          '<div class="legend-item" style="margin-left:10px;"><span class="legend-color" style="display:inline-block;width:15px;height:15px;background-color:#ff7f0e;border-radius:50%;margin-right:5px;"></span>Type 2</div>' +
          '<div class="legend-item" style="margin-left:10px;"><span class="legend-color" style="display:inline-block;width:15px;height:15px;background-color:#2ca02c;border-radius:50%;margin-right:5px;"></span>Type 3</div>';
      } else if (colorBy === 'centrality') {
        document.getElementById('legend-content').innerHTML =
          '<div class="legend-item"><span class="legend-color" style="display:inline-block;width:15px;height:15px;background-color:' + centralityColorScale(0).toString() + ';border-radius:50%;margin-right:5px;"></span>Low Centrality</div>' +
          '<div class="legend-item" style="margin-left:10px;"><span class="legend-color" style="display:inline-block;width:15px;height:15px;background-color:' + centralityColorScale(0.5).toString() + ';border-radius:50%;margin-right:5px;"></span>Medium Centrality</div>' +
          '<div class="legend-item" style="margin-left:10px;"><span class="legend-color" style="display:inline-block;width:15px;height:15px;background-color:' + centralityColorScale(1).toString() + ';border-radius:50%;margin-right:5px;"></span>High Centrality</div>';
      } else if (colorBy === 'degree') {
        const maxDegree = d3.max(data.nodes, d => d.degree);
        document.getElementById('legend-content').innerHTML =
          '<div class="legend-item"><span class="legend-color" style="display:inline-block;width:15px;height:15px;background-color:' + degreeColorScale(0).toString() + ';border-radius:50%;margin-right:5px;"></span>Low Degree</div>' +
          '<div class="legend-item" style="margin-left:10px;"><span class="legend-color" style="display:inline-block;width:15px;height:15px;background-color:' + degreeColorScale(maxDegree / 2).toString() + ';border-radius:50%;margin-right:5px;"></span>Medium Degree</div>' +
          '<div class="legend-item" style="margin-left:10px;"><span class="legend-color" style="display:inline-block;width:15px;height:15px;background-color:' + degreeColorScale(maxDegree).toString() + ';border-radius:50%;margin-right:5px;"></span>High Degree</div>';
      }
    };

    // Function triggered on simulation tick
    const ticked = () => {
      svg.selectAll('.links line')
         .attr('x1', d => d.source.x)
         .attr('y1', d => d.source.y)
         .attr('x2', d => d.target.x)
         .attr('y2', d => d.target.y);
      svg.selectAll('.nodes circle')
         .attr('cx', d => d.x)
         .attr('cy', d => d.y);
    };

    // Drag event handlers
    function dragstarted(event, d) {
      if (!event.active) simulation.alphaTarget(0.3).restart();
      d.fx = d.x;
      d.fy = d.y;
    }
    function dragged(event, d) {
      d.fx = event.x;
      d.fy = event.y;
    }
    function dragended(event, d) {
      if (!event.active) simulation.alphaTarget(0);
      if (document.getElementById('layout').value === 'force') {
        d.fx = null;
        d.fy = null;
      }
    }

    // Add event listeners on controls to trigger updates
    document.getElementById('node-filter').addEventListener('change', updateVisualization);
    document.getElementById('layout').addEventListener('change', updateVisualization);
    document.getElementById('color-by').addEventListener('change', updateVisualization);
    document.getElementById('search').addEventListener('input', updateVisualization);
    document.getElementById('edge-filter').addEventListener('input', function() {
      document.getElementById('edge-filter-value').textContent = this.value;
      updateVisualization();
    });
    document.getElementById('reset').addEventListener('click', function() {
      document.getElementById('node-filter').value = 'all';
      document.getElementById('edge-filter').value = '1';
      document.getElementById('edge-filter-value').textContent = '1';
      document.getElementById('search').value = '';
      document.getElementById('layout').value = 'force';
      document.getElementById('color-by').value = 'type';
      updateVisualization();
    });

    // Initial draw of the network graph
    updateVisualization();

    // Handle window resize events
    window.addEventListener('resize', function() {
      const newWidth = document.getElementById('graph').clientWidth;
      svg.attr('width', newWidth);
      simulation.force('center', d3.forceCenter(newWidth / 2, height / 2));
      simulation.alpha(1).restart();
    });
  </script>
</body>
</html>
Analysis and Discussion
The code above is designed to serve as a robust framework for visualizing complex networks. By integrating various filtering options, the visualization makes it simple to isolate nodes based on their type or specific search criteria. The slider controlling the edge weight filter adds another level of control, ensuring that low-weight connections can be de-emphasized or completely removed from view, thereby providing a clearer view of the core network structure.
Furthermore, the ability to switch between different layout types – including force-directed, circular, and grid layouts – highlights the flexibility of the system and allows users to gain different insights into the network topology. For instance, a circular layout can reveal symmetric patterns and clusters, whereas a grid layout might be more suited to stable, orderly representations when comparing node degrees and link distribution.
The dynamic legend, which updates based on the selected coloring parameter, further enhances user comprehension by visually categorizing nodes. Colors correspond to predetermined schemes whether nodes are grouped by type, centrality, or degree, ensuring that the visualization is both informative and engaging.
A dedicated statistics panel automatically computes and displays key indicators such as the total number of nodes and edges, average degree, and network density. This real-time update of network metrics serves analytical purposes and provides immediate feedback during interaction.
Conclusion and Final Thoughts
This implementation of an interactive network graph integrates advanced D3.js techniques with comprehensive filtering capabilities and diverse visualization layouts. The code is designed to be adaptable, so you can replace the sample network data with your own dataset to suit a wide range of analytical applications. The intuitive design of the filtering system, real-time statistics, and dynamic legend ensure that both casual viewers and technical users can derive valuable insights from the graph. Overall, this example provides a solid base for creating visually appealing and analytical network visualizations, perfect for educational, research, or data analysis purposes.
References
- D3.js - D3 Data Driven Documents
- Network Graph Visualization Techniques
- How to Make an Interactive Network Visualization
- Creating Interactive Network Graphs
Recommended Further Exploration
Last updated February 25, 2025