
Unlock Flawless Web Experiences: Master JavaScript Frontend Debugging
Navigate the complexities of frontend errors with essential techniques and tools for cleaner, more reliable code.
Debugging Essentials Highlights
- Browser Developer Tools are Key: Mastering tools like Chrome DevTools or Firefox Developer Tools (Console, Sources, Network, Elements panels) is fundamental for inspecting, modifying, and understanding frontend code behavior in real-time.
- Strategic Breakpoints & Logging: Combining the power of breakpoints (pausing execution) with targeted
console.log()statements provides deep insights into code flow, variable states, and asynchronous operations. - Isolate and Conquer: Effective debugging often involves systematically isolating the problematic code segment, reproducing the bug consistently, and understanding error messages to pinpoint the root cause efficiently.
Understanding the Art of Debugging
Debugging is an indispensable phase in the software development lifecycle. It's the systematic process of identifying, analyzing, and resolving defects or "bugs" within software code. For frontend JavaScript development, this process takes on unique challenges due to the dynamic nature of the language, the complexity of user interfaces, asynchronous operations (like fetching data), and the variety of browser environments where the code runs. Effective debugging ensures application quality, performance, stability, and ultimately, user satisfaction.
Core Principles Applicable Everywhere
While frontend JavaScript has its specifics, several fundamental debugging techniques apply broadly across software development:
- Understand the Problem Deeply: Before diving into code, clearly define the bug. What are the symptoms? When does it occur? Can it be reproduced consistently? Gather as much context as possible.
- Backtracking: Start from where the error manifests and trace the execution flow backward. Analyze logs, function calls, and state changes to pinpoint where things went wrong.
- Isolate the Issue (Divide and Conquer): Simplify the problem. Comment out sections of code, disable features, or create a minimal test case that reproduces the bug. This narrows down the search area significantly. This is sometimes referred to as a binary search approach within the codebase.
- Analyze Logs and Error Messages: System logs and error messages generated by the browser or JavaScript runtime provide crucial clues. Learn to interpret stack traces and error types.
- Rubber Duck Debugging: Explain the problem and your code's logic step-by-step to someone else, or even an inanimate object (like a rubber duck). Articulating the issue often illuminates overlooked flaws or assumptions.
- Hypothesis Testing (Cause Elimination): Formulate hypotheses about the cause of the bug and test them systematically. Eliminate potential causes one by one until the root cause is identified.
Mastering JavaScript Frontend Debugging
Debugging JavaScript in the browser requires proficiency with specific tools and techniques tailored to the frontend environment. Here's a breakdown of the most crucial aspects:
Leveraging Browser Developer Tools
Built directly into modern web browsers (Chrome, Firefox, Edge, Safari), Developer Tools (DevTools) are the frontend developer's primary debugging suite. Typically opened with F12 or right-clicking an element and selecting "Inspect," they offer several powerful panels:
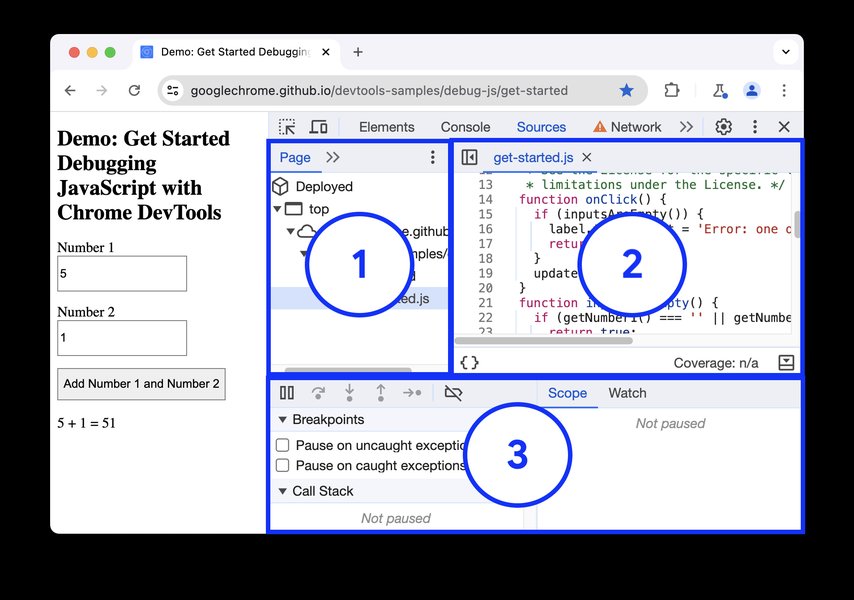
An overview of the Chrome DevTools Sources panel interface.
The Console Panel
The Console is indispensable for:
- Logging Information: Using `console.log()`, `console.warn()`, `console.error()`, `console.info()` to output variable values, messages, and track execution flow.
- Advanced Logging: Employing `console.table()` for structured object/array display, `console.group()` / `console.groupEnd()` for organizing logs, and `console.trace()` to view the call stack leading to a log statement.
- Timing Operations: Using `console.time('label')` and `console.timeEnd('label')` to measure the duration of code blocks.
- Executing Code Snippets: Running arbitrary JavaScript directly within the page's current context to test functions or inspect the state of global variables or specific elements (`$0` often refers to the currently selected element).
- Viewing Errors and Warnings: Displaying JavaScript errors, CSS warnings, and network issues, complete with stack traces to pinpoint the source file and line number.
The Sources Panel
This is where you interact directly with your JavaScript code:
- Viewing Files: Navigate through the loaded source files (HTML, CSS, JS), including those provided via source maps.
- Setting Breakpoints: Click on a line number to set a breakpoint, pausing JavaScript execution when it hits that line.
- Stepping Through Code: Once paused, use controls to step over the current line, step into a function call, step out of the current function, or resume execution.
- Inspecting Scope and Variables: Examine the values of local, closure, and global variables at the point of pause.
- Watch Expressions: Define variables or expressions to monitor their values as you step through the code.
- Call Stack Inspection: See the sequence of function calls that led to the current breakpoint.
- Source Maps: Essential for debugging code that has been transpiled (e.g., TypeScript to JavaScript) or minified. Source maps link the executed code back to your original source, making debugging intuitive.
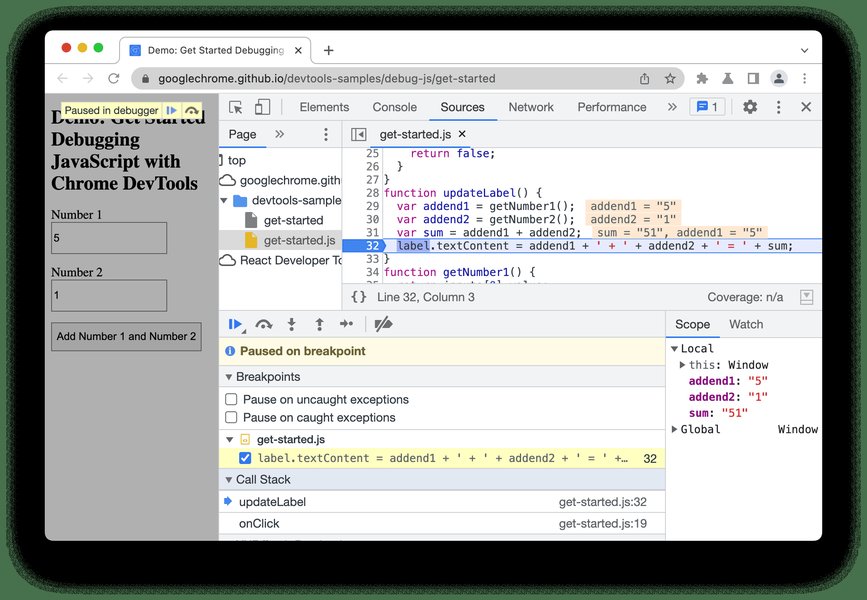
Execution paused at a specific line of code using a breakpoint in the Sources panel.
The Elements Panel
Ideal for debugging HTML structure and CSS styles:
- Live DOM Inspection: View the rendered HTML structure.
- Real-time Style Editing: Modify CSS rules and see changes instantly. Useful for diagnosing layout or styling issues.
- Computed Styles: See the final calculated styles applied to an element after all stylesheets and inline styles are considered.
- Event Listeners: Inspect event listeners attached to DOM elements.
The Network Panel
Crucial for debugging issues related to data fetching and APIs:
- Monitor Requests: Track all network requests (XHR/Fetch, images, scripts, stylesheets).
- Inspect Headers and Payloads: View request/response headers, parameters, and data payloads.
- Check Status Codes: Verify HTTP status codes (e.g., 200 OK, 404 Not Found, 500 Internal Server Error).
- Analyze Timing: Understand how long different phases of a request take (DNS lookup, connection, waiting, content download).
- Simulate Network Conditions: Throttle network speed or simulate offline status to test application behavior under different conditions.
- Replay Requests: Re-send specific network requests to test backend responses.
Mastering Breakpoints
Breakpoints are powerful tools for pausing code execution at precise moments to inspect the program's state.
Types of Breakpoints:
- Line-of-Code Breakpoints: The most common type, set on a specific line in the Sources panel.
- Conditional Breakpoints: Trigger only when a specific JavaScript expression evaluates to true. Right-click a line number to add a condition.
- Logpoints: Instead of pausing, log a message or expression value to the console when hit. A less intrusive alternative to adding `console.log` statements directly in the code.
- DOM Change Breakpoints: Pause execution when a specific DOM node or its attributes/subtree are modified. Set these from the Elements panel.
- Event Listener Breakpoints: Pause when a specific type of event (e.g., 'click', 'keyup') is triggered. Found in the Sources panel.
- XHR/Fetch Breakpoints: Pause when an AJAX request matching a specific URL or pattern is made. Configured in the Sources panel.
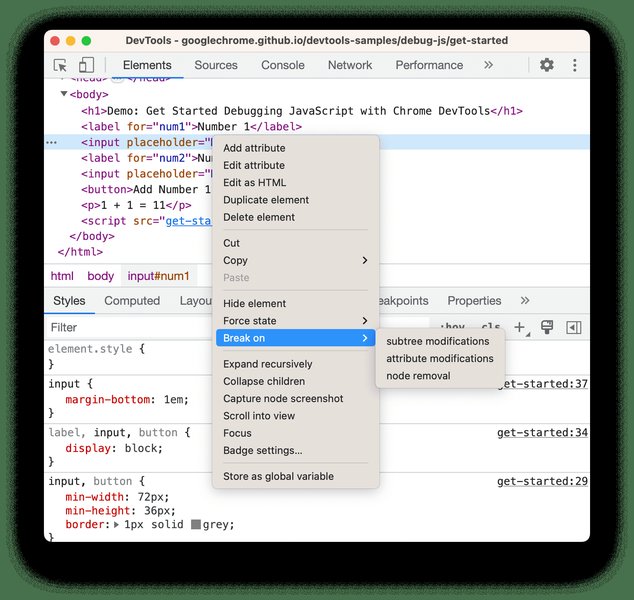
Setting up a conditional breakpoint via the context menu in the Sources panel.
The `debugger;` Statement
You can also programmatically trigger the debugger by inserting the `debugger;` statement directly into your JavaScript code. When the browser encounters this statement *and* the DevTools are open, execution will pause as if a breakpoint were set on that line.
function potentiallyBuggyFunction(data) {
  console.log('Starting function with:', data);
  // Let's inspect the state here if DevTools are open
  debugger;
  // ... rest of the function logic ...
  const result = data * 2;
  console.log('Function result:', result);
  return result;
}
Effective Error Handling
- Use `try...catch` Blocks: Wrap potentially problematic code (especially synchronous operations that might throw errors) in `try...catch` blocks to handle exceptions gracefully without crashing the entire script.
- Handle Promise Rejections: For asynchronous operations using Promises (like Fetch API calls), always attach a `.catch()` handler or use `try...catch` with `async/await` to handle potential errors (e.g., network failures, server errors).
- Interpret Stack Traces: When an error occurs, the console displays a stack trace, showing the sequence of function calls leading up to the error. Learn to read these traces to understand the context and origin of the bug.
- Global Error Handlers: Implement `window.onerror` or `window.addEventListener('error', handler)` and `window.addEventListener('unhandledrejection', handler)` to catch uncaught exceptions and unhandled promise rejections globally, allowing for centralized logging or reporting.
Comparing Frontend Debugging Techniques
Different debugging techniques serve various purposes and have varying levels of complexity and effectiveness depending on the situation. The radar chart below provides a visual comparison based on common criteria for key frontend JavaScript debugging approaches.
This chart illustrates the relative strengths and common use cases of different debugging approaches. For instance, `console.log` is easy and frequently used but offers less depth than breakpoints. Element inspection excels for UI issues, while network analysis is vital for API problems, and performance profiling targets optimization.
Visualizing the Debugging Landscape
The mind map below provides a structured overview of the key areas involved in debugging frontend JavaScript applications, connecting tools, techniques, and common problem domains.
This map highlights the interconnectedness of tools like DevTools, fundamental techniques like logging and breakpoints, specialized areas like async debugging, and the role of external tools and practices in a robust debugging strategy.
Essential Tools and Utilities
Beyond the browser's built-in tools, several other utilities and services aid in debugging:
- IDE Debuggers: Code editors like Visual Studio Code (VS Code) offer integrated debugging capabilities. You can set breakpoints, step through code, and inspect variables directly within the editor, often connecting to a running browser instance for seamless frontend debugging.
- Linters and Formatters: Tools like ESLint and Prettier help catch syntax errors, potential bugs, and enforce code style consistency *before* the code even runs, preventing entire classes of issues.
- Error Tracking Services: Platforms like Sentry, TrackJS, Bugsnag, or Raygun automatically capture and report JavaScript errors that occur for users in production. They provide detailed context, stack traces, browser information, and user actions leading up to the error, invaluable for diagnosing real-world issues.
- Time Travel Debugging: More advanced tools (some experimental or integrated into specific frameworks/platforms) allow stepping *backward* as well as forward through code execution, making it easier to trace the origin of complex state-related bugs.
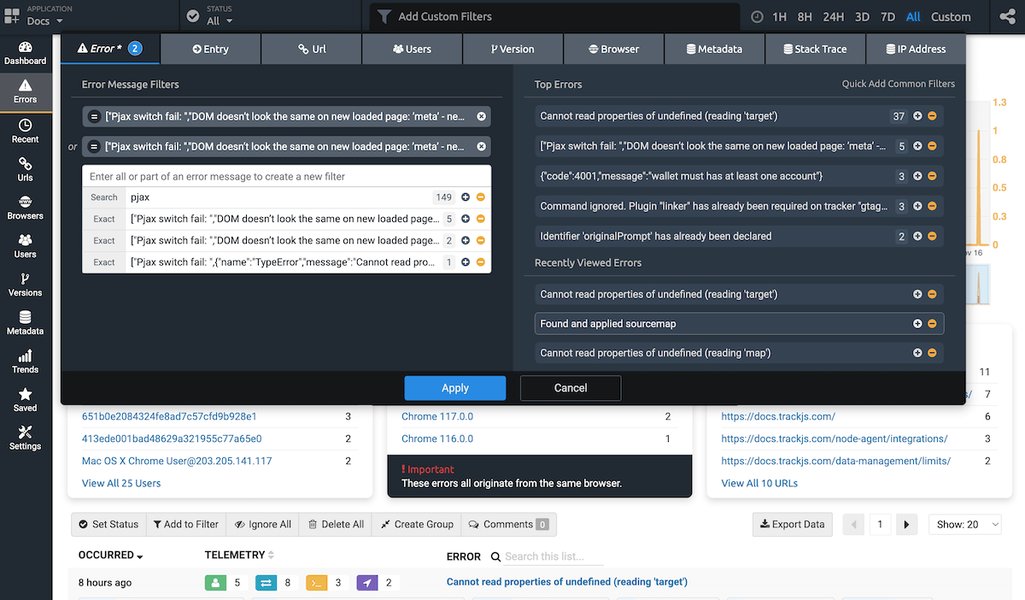
Example interface of an error tracking tool (TrackJS) used for monitoring frontend errors.
Debugging Techniques Comparison Table
This table summarizes key debugging techniques, highlighting their primary uses, advantages, and disadvantages in the context of JavaScript frontend development.
| Technique | Description | Primary Use Case (Frontend JS) | Pros | Cons |
|---|---|---|---|---|
| Console Logging (`console.log`, etc.) | Inserting statements to output variable values or messages to the DevTools console. | Quickly checking variable states, tracing execution flow, simple error reporting. | Easy to implement, universally available, good for tracking values over time. | Can clutter code and console, requires code modification, less effective for complex state inspection, doesn't pause execution. |
| Breakpoints & Stepping | Using DevTools (or `debugger;` statement) to pause code execution at specific points and examine the state. | In-depth analysis of code execution, inspecting scope/variables/call stack at a specific moment, diagnosing complex logic. | Allows deep inspection, interactive debugging, step-by-step analysis, conditional pausing. | Requires DevTools, can be slower for simple checks, might disrupt timing-sensitive operations. |
| DevTools Elements/Styles Inspection | Using the Elements panel to view/modify the DOM structure and CSS rules in real-time. | Diagnosing layout issues, styling problems, CSS conflicts, inspecting element properties. | Instant visual feedback, direct manipulation of HTML/CSS, great for UI-related bugs. | Primarily for visual/layout issues, doesn't directly debug JavaScript logic. |
| DevTools Network Analysis | Using the Network panel to monitor and inspect HTTP requests and responses. | Debugging API calls (Fetch/XHR), checking data payloads, diagnosing loading issues, verifying headers/status codes. | Essential for client-server interaction issues, detailed request/response info, performance timing. | Specific to network communication, doesn't debug client-side JS logic directly. |
| Error Handling (`try/catch`, `.catch()`) | Implementing code structures to gracefully handle runtime errors and promise rejections. | Preventing application crashes, managing expected errors (e.g., failed API calls), logging/reporting errors. | Improves application robustness, allows specific error recovery logic. | Can mask underlying issues if overused or used incorrectly, adds code overhead. |
| Isolation / Divide & Conquer | Systematically commenting out or simplifying code sections to pinpoint the source of a bug. | Narrowing down the location of bugs in large or complex codebases. | Methodical, effective for complex bugs, helps understand code dependencies. | Can be time-consuming, requires careful testing at each step. |
| Error Tracking Services | Using third-party platforms to automatically capture and report errors from live user sessions. | Monitoring production applications, diagnosing errors that are hard to reproduce locally, understanding real-world usage patterns. | Aggregated error data, rich context (browser, OS, user actions), identifies widespread issues. | Requires setup and subscription, primarily for post-deployment monitoring, doesn't help with local development debugging directly. |
Debugging JavaScript with Chrome DevTools
Many developers initially rely heavily on `console.log()` for debugging. While useful, mastering the browser's built-in debugger offers far more power and efficiency for complex problems. The video below provides an excellent introduction to moving beyond basic logging and utilizing the debugging features within Chrome DevTools effectively.
This tutorial covers essential concepts like setting breakpoints, stepping through code, inspecting variables, and understanding the call stack, demonstrating why the integrated debugger is often a more powerful tool than relying solely on logging output for diagnosing intricate JavaScript issues.
Frequently Asked Questions (FAQ)
What are the most common types of JavaScript frontend bugs?
How do source maps help with debugging?
When should I use console.log vs. breakpoints?
What is "Rubber Duck Debugging"?
Recommended Reading
- Explore advanced features of Chrome DevTools for JavaScript debugging.
- Discover specific techniques for tackling bugs in promises and async/await functions.
- Learn about robust error handling strategies for more resilient web applications.
- Find out how to use browser tools to identify and fix performance bottlenecks in your code.
References

Last updated May 4, 2025