
Unraveling the Mathematical Connection: L0 Loss and Order Statistics in Machine Learning
Exploring how these fundamental statistical concepts interact in optimization, feature selection, and robust model evaluation
Key Insights
- L0 loss is a sparsity-inducing function that counts non-zero elements, making it valuable for feature selection despite optimization challenges
- Order statistics organize random variables by rank, providing crucial tools for analyzing data distributions and making statistical inferences
- These concepts intersect in practical applications including robust modeling, sparse representation, and prioritizing misclassifications
Understanding L0 Loss
L0 loss (also called L0 norm or sparsity loss) is a mathematical concept primarily used in machine learning and statistics to induce sparsity in model parameters. Unlike more common loss functions like L1 (absolute deviation) or L2 (squared error), L0 loss specifically counts the number of non-zero elements in a vector.
Mathematical Definition
For a vector β, the L0 loss can be defined as:
\[ L_0(\beta) = \sum_{i=1}^{n} \mathbb{1}(\beta_i \neq 0) \]Where \(\mathbb{1}(\cdot)\) is the indicator function that equals 1 when the condition is true and 0 otherwise. In classification contexts, L0 loss can also refer to the count of misclassifications:
\[ L_0(y, \hat{y}) = \begin{cases} 1 & \text{if } y \neq \hat{y} \ 0 & \text{if } y = \hat{y} \end{cases} \]Key Properties and Challenges
Non-Differentiability and Optimization
The L0 loss function is non-differentiable and non-convex, making it exceptionally challenging to optimize directly using standard gradient-based methods. This has led to various approximation techniques and alternative approaches.
Applications in Machine Learning
Despite its optimization challenges, L0 loss is valued for:
- Feature Selection: Identifying the most important features by penalizing models that use too many variables
- Model Compression: Creating smaller, more efficient models by driving unnecessary weights to zero
- Sparse Representation: Developing models that rely on only a few critical parameters
Understanding Order Statistics
Order statistics involve arranging a sample of observations in ascending or descending order and analyzing the properties of this ranked data. They form a fundamental concept in statistical theory with widespread applications.
Mathematical Definition
Given a random sample \(X_1, X_2, \ldots, X_n\) from a population, the order statistics are denoted as \(X_{(1)}, X_{(2)}, \ldots, X_{(n)}\) where:
\[ X_{(1)} \leq X_{(2)} \leq \ldots \leq X_{(n)} \]Here, \(X_{(k)}\) represents the k-th smallest value in the sample (the k-th order statistic).
Common Order Statistics
- Minimum: \(X_{(1)}\) (first order statistic)
- Maximum: \(X_{(n)}\) (n-th order statistic)
- Median: \(X_{((n+1)/2)}\) for odd n or \(\frac{X_{(n/2)} + X_{(n/2+1)}}{2}\) for even n
- Quartiles: The 25th, 50th, and 75th percentiles of the ordered data
Applications
Statistical Analysis
Order statistics are essential in non-parametric methods, outlier detection, and constructing confidence intervals without assuming a specific distribution.
Reliability Analysis
They help analyze system failures and component lifetimes, particularly in engineering and quality control.
Extreme Value Theory
The study of maximal and minimal values in samples, crucial for modeling rare events like floods or market crashes.
The Relationship Between L0 Loss and Order Statistics
While L0 loss and order statistics originate from different areas of statistical theory, they intersect in several meaningful ways, particularly in machine learning applications:
Connections in Feature Selection
When using L0 regularization for feature selection, order statistics can be employed to rank features based on their importance. This allows data scientists to select only the top-k most significant features, creating sparse and interpretable models.
Example Implementation
import numpy as np

# Simulated feature importance scores
feature_importance = np.array([0.05, 0.32, 0.01, 0.25, 0.18, 0.03, 0.42])

# Using order statistics to select top-3 features
k = 3
top_k_indices = np.argsort(feature_importance)[-k:]
selected_features = top_k_indices[np.argsort(top_k_indices)]

print(f"Selected feature indices: {selected_features}")
print(f"Their importance scores: {feature_importance[selected_features]}")
Analyzing Misclassification Patterns
When L0 loss is interpreted as the count of misclassifications, order statistics can help analyze these errors by ranking them according to their severity or impact. This allows for targeted improvement of model performance by focusing on the most critical mistakes.
Robust Methods and Outlier Handling
Both concepts contribute to robust statistical methods. L0 loss, with its inherent sparsity promotion, can help create models resistant to outliers. Similarly, order statistics support robust analyses by focusing on the relative positioning of data points rather than their absolute values.
Comparative Analysis Using Radar Chart
The radar chart above compares the strengths of L0 loss, order statistics, and a combined approach across various dimensions. As shown, L0 loss excels in sparsity promotion and feature selection, while order statistics are particularly strong in distribution analysis and statistical inference. A combined approach leverages the strengths of both techniques.
Conceptual Framework: Mindmap of L0 Loss and Order Statistics
The following mindmap illustrates the key concepts, applications, and relationships between L0 loss and order statistics in statistical learning and machine learning contexts:
Practical Applications and Implementation
Comparison of Properties
| Property | L0 Loss | Order Statistics | Combined Approach |
|---|---|---|---|
| Primary Focus | Counting non-zero elements | Ranking of data points | Sparse ranking techniques |
| Mathematical Nature | Non-differentiable, non-convex | Distributional, rank-based | Complex optimization with ranking constraints |
| Optimization Difficulty | Very challenging (NP-hard) | Relatively straightforward | Challenging but tractable with approximations |
| Key Applications | Feature selection, model compression | Non-parametric tests, quantile estimation | Robust feature selection, anomaly detection |
| Robustness to Outliers | Moderate (depends on implementation) | High (especially median-based methods) | Very high (combines benefits of both) |
| Computational Complexity | High (often requires approximation) | O(n log n) for sorting-based implementation | High, but can be optimized for specific cases |
| Interpretability | High (directly counts important features) | High (rank-based interpretation) | Moderate (may involve complex interactions) |
Educational Video: Order Statistics Explained
The following video provides an excellent introduction to order statistics, which can help deepen your understanding of this fundamental concept:
Dr. Harish Garg explains order statistics with practical examples, making the concept accessible even for those new to statistical theory. This foundational knowledge is crucial for understanding how order statistics can be combined with L0 loss in machine learning applications.
Illustrative Examples and Images
The following images help visualize key concepts related to statistical distributions and machine learning loss functions:
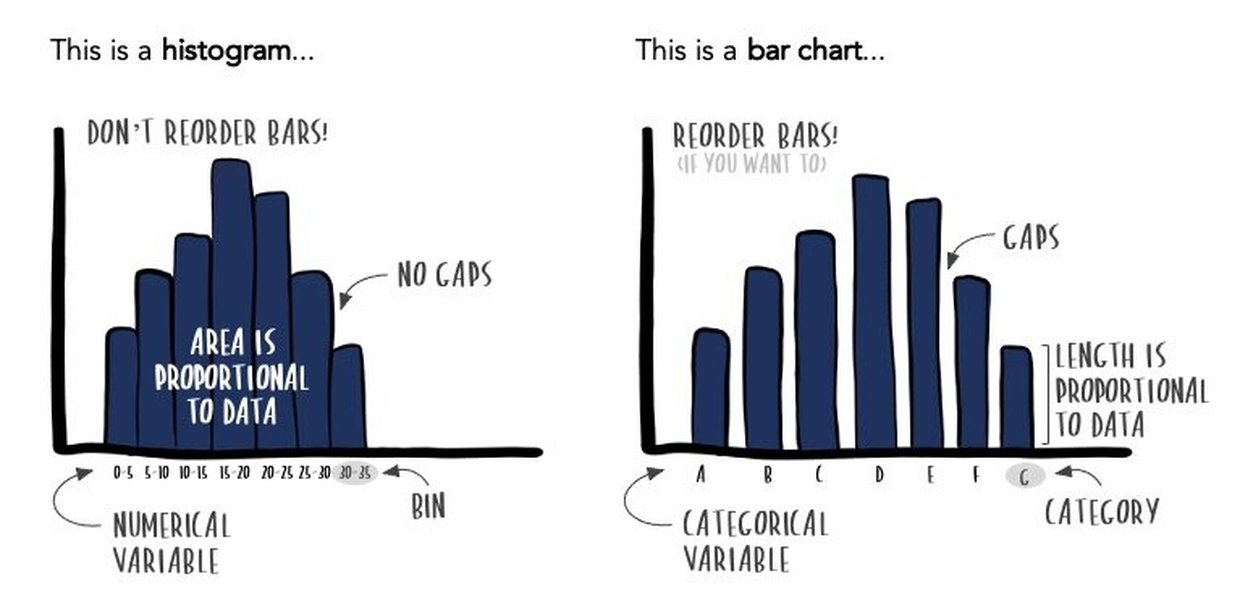
Histograms are a visual representation of order statistics, showing the distribution of data points across defined intervals.
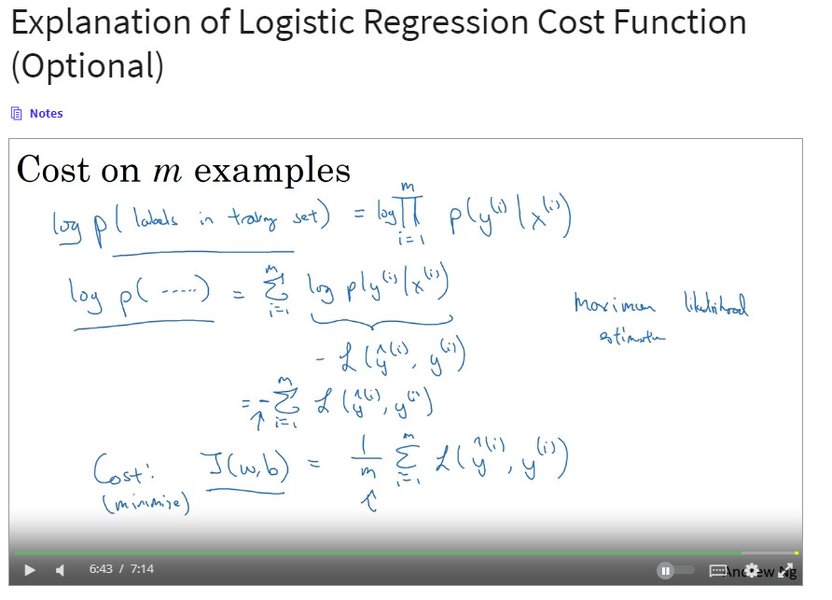
Loss functions like the one shown above guide optimization in machine learning. The L0 loss would create a discontinuous step function that counts misclassifications.
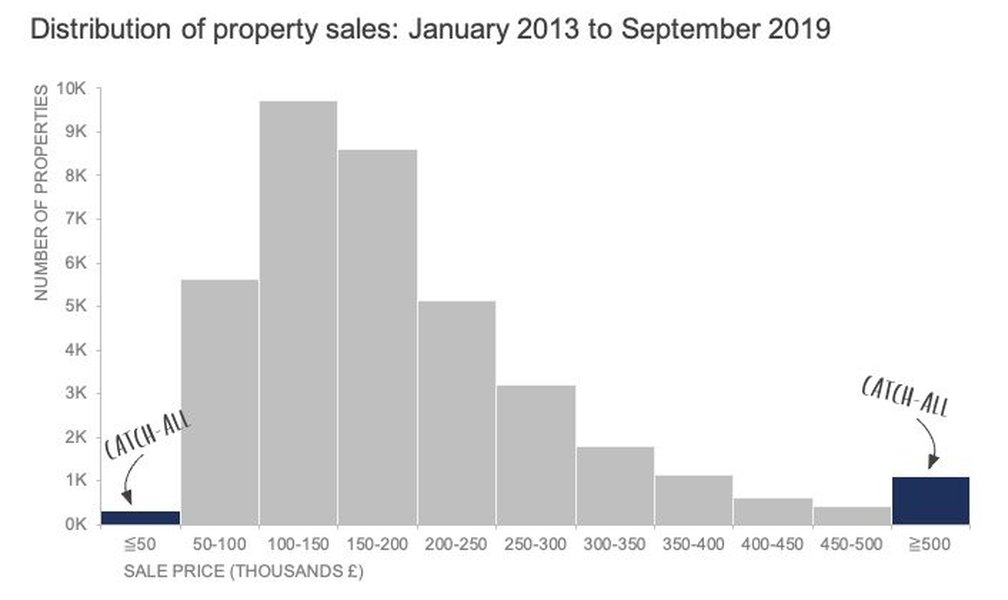
Order statistics help analyze distributions shown in histograms, while L0 loss might be used to identify the most significant features driving these distributions.
FAQ: Common Questions About L0 Loss and Order Statistics
References
- Order statistic - Wikipedia
- L0 and Lp Loss Functions in Model-Robust Estimation of Structural Equation Models - MDPI
-
Order Statistics - an overview | ScienceDirect Topics
- Introduction to Order Statistics - Analytics Vidhya
- Array Order Statistics - GeeksforGeeks
- What is: Order Statistic - Statistics Easily
Recommended Searches
Last updated April 8, 2025