
Unlock Operational Excellence: Your Comprehensive Lean Six Sigma Guide
Master the tools and methodologies to streamline processes, eliminate waste, and boost quality.
Thank you for your request! While I cannot directly generate a PDF file and embed your personal details (HBANE ABDELHAQ, a.hbane2470@uca.ac.ma) into it due to technical limitations, I can provide you with the complete, comprehensive Lean Six Sigma tutorial content right here.
You can easily create your personalized PDF by:
- Copying the text from this tutorial.
- Pasting it into a word processor (like Microsoft Word, Google Docs, etc.).
- Using the software's features to add "HBANE ABDELHAQ | a.hbane2470@uca.ac.ma" to the footer or bottom margin of each page.
- Saving or exporting the document as a PDF file.
This guide synthesizes information from leading resources to give you a thorough understanding of Lean Six Sigma principles, tools, and practices.
Key Highlights of Lean Six Sigma
- Synergistic Power: Lean Six Sigma combines Lean's focus on speed and waste elimination with Six Sigma's emphasis on quality and variation reduction for maximum operational impact.
- Structured Problem-Solving: The DMAIC (Define, Measure, Analyze, Improve, Control) framework provides a rigorous, data-driven roadmap for tackling process challenges and achieving sustainable improvements.
- Customer-Centric Value: At its core, Lean Six Sigma aims to enhance customer satisfaction by optimizing processes to deliver greater value, higher quality, and faster service with fewer resources.
Understanding Lean Six Sigma: A Powerful Fusion
Lean Six Sigma represents a potent, integrated methodology designed to propel organizations towards operational excellence. It achieves this by strategically merging two distinct but complementary improvement philosophies: Lean and Six Sigma.
The Lean Component: Eliminating Waste
Originating largely from the Toyota Production System, Lean thinking centers on maximizing customer value while minimizing waste. It focuses on streamlining processes by identifying and eliminating activities that do not add value from the customer's perspective. Lean targets the "Eight Wastes" (often remembered by the acronym DOWNTIME):
- Defects: Errors requiring rework or scrap.
- Overproduction: Producing more than needed or before it's needed.
- Waiting: Idle time caused by process delays or bottlenecks.
- Non-Utilized Talent: Failing to leverage employees' skills and ideas.
- Transportation: Unnecessary movement of materials or information.
- Inventory: Excess stock tying up capital and space.
- Motion: Unnecessary movement of people.
- Extra-Processing: Doing more work than necessary or required by the customer.
Lean aims to create smooth, efficient workflows where value flows uninterrupted to the customer.
The Six Sigma Component: Reducing Variation
Six Sigma is a disciplined, statistical-based, data-driven approach focused on eliminating defects and reducing variation in processes. Its goal is ambitious: to achieve a quality level where processes produce no more than 3.4 defects per million opportunities (DPMO). This translates to a process performance level of 99.99966% accuracy. Six Sigma relies heavily on statistical tools and a structured problem-solving methodology, typically DMAIC, to identify root causes of defects and implement solutions that minimize variability and improve process predictability.
The Synergy: Why Combine Them?
Combining Lean and Six Sigma creates a comprehensive toolkit for improvement. Lean principles help identify areas of waste and improve process flow, making processes faster and more efficient. Six Sigma provides the statistical rigor to analyze these processes deeply, identify root causes of variation and defects, and implement robust solutions. Together, they address both efficiency (doing things faster) and effectiveness (doing things right), leading to significant improvements in cost, quality, speed, and customer satisfaction.
The DMAIC Framework: A Roadmap for Improvement
The most widely used methodology within Lean Six Sigma is DMAIC, a systematic five-phase approach for data-driven process improvement.
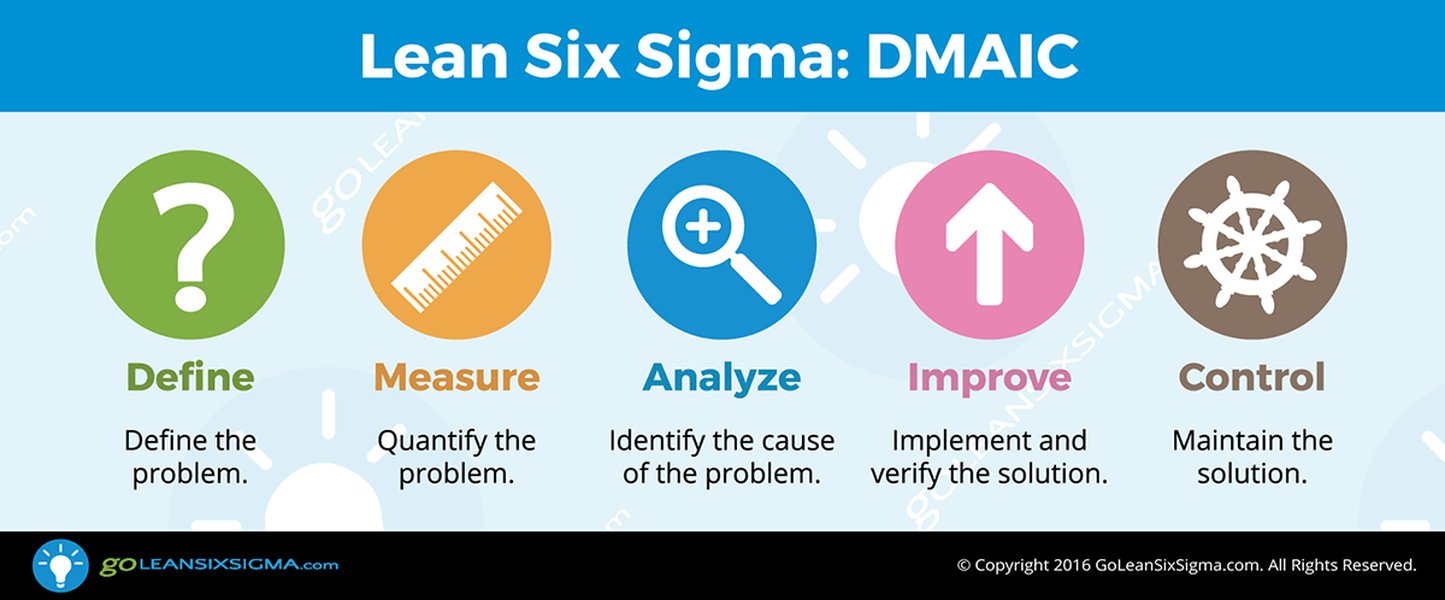
The DMAIC Cycle provides a structured approach to problem-solving.
Phase 1: Define
Objective: Clearly articulate the problem, project goals, scope, and customer requirements.
This phase sets the stage for the entire project. Activities include defining the problem statement, identifying stakeholders, understanding the Voice of the Customer (VoC), and establishing clear project objectives and boundaries.
Common Tools:
- Project Charter: A formal document outlining the project's purpose, scope, objectives, team members, and timeline.
- SIPOC Diagram (Suppliers, Inputs, Process, Outputs, Customers): A high-level map providing a visual overview of the process and its key elements.
- Voice of the Customer (VoC) Analysis: Techniques like surveys, interviews, and focus groups to capture customer needs and expectations.
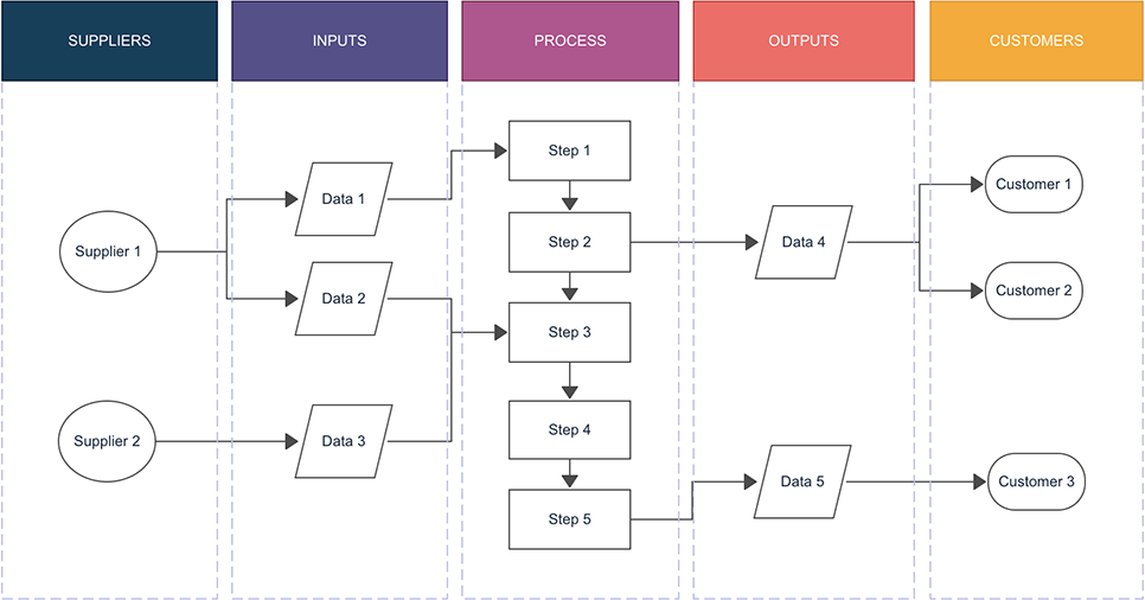
A SIPOC diagram helps define the scope and elements of a process.
Phase 2: Measure
Objective: Collect data to establish baseline performance and quantify the problem.
In this phase, the team focuses on understanding the current state of the process. This involves identifying key metrics, developing a data collection plan, validating the measurement system, and gathering baseline data.
Common Tools:
- Process Mapping: Creating detailed flowcharts of the current process to visualize steps and potential issues.
- Data Collection Plan: Defining what data is needed, how it will be collected, and who will collect it.
- Measurement System Analysis (MSA) / Gauge R&R: Assessing the accuracy and reliability of the measurement system.
- Basic Statistical Analysis: Calculating baseline metrics like mean, median, standard deviation, and process capability (e.g., Sigma level, DPMO).
- Run Charts & Histograms: Visualizing data patterns and distribution over time.
Calculating Defects Per Million Opportunities (DPMO):
\[ \text{DPMO} = \left( \frac{\text{Number of Defects}}{\text{Number of Units} \times \text{Number of Opportunities per Unit}} \right) \times 1,000,000 \]Phase 3: Analyze
Objective: Identify, validate, and prioritize the root causes of the problem.
Here, the team analyzes the collected data and explores potential causes contributing to the problem defined in Phase 1 and measured in Phase 2. The goal is to pinpoint the vital few factors that significantly impact performance.
Common Tools:
- Root Cause Analysis (RCA): Techniques like the 5 Whys and Fishbone (Ishikawa) diagrams to drill down to underlying causes.
- Pareto Charts: Identifying the most significant factors (applying the 80/20 rule).
- Hypothesis Testing: Using statistical tests (e.g., t-tests, ANOVA) to validate potential root causes with data.
- Regression Analysis: Examining relationships between input variables and output performance.
- Value Stream Mapping (VSM): Analyzing the flow of materials and information to identify waste and delays.
Phase 4: Improve
Objective: Develop, test, and implement solutions to address the root causes.
Based on the analysis, this phase focuses on generating creative solutions, evaluating them, piloting the best options, and implementing the chosen improvements to eliminate or mitigate the identified root causes.
Common Tools:
- Brainstorming & Solution Prioritization Matrices: Generating and selecting potential solutions.
- Design of Experiments (DOE): Systematically testing multiple factors to find optimal process settings.
- Pilot Testing: Implementing solutions on a small scale to test effectiveness before full rollout.
- 5S Methodology (Sort, Set in Order, Shine, Standardize, Sustain): Organizing the workplace for efficiency and effectiveness.
- Kaizen Events: Focused, short-term workshops to implement rapid improvements.
- Poka-Yoke (Mistake-Proofing): Designing processes to prevent errors from occurring.
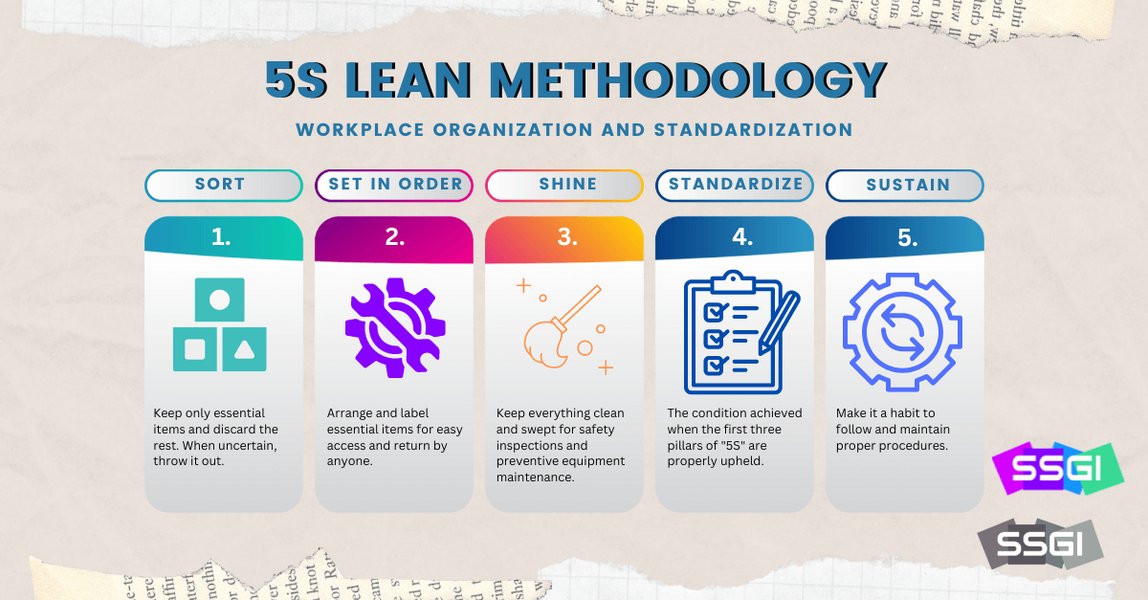
The 5S methodology improves workplace organization and efficiency.
Phase 5: Control
Objective: Sustain the gains achieved and ensure the improvements stick long-term.
The final phase involves standardizing the improved process, implementing monitoring systems, documenting changes, and creating plans to ensure the improvements are maintained over time and don't revert to the old ways.
Common Tools:
- Statistical Process Control (SPC) Charts: Monitoring process performance over time to detect deviations.
- Control Plans: Documenting how the improved process will be managed and monitored.
- Standard Operating Procedures (SOPs): Updating documentation to reflect the new process.
- Training Plans: Ensuring relevant staff are trained on the new procedures.
- Project Closure Report: Documenting the project results, lessons learned, and final outcomes.
Calculating Process Capability (Cp):
\[ C_p = \frac{\text{USL} - \text{LSL}}{6 \sigma} \]Where USL is the Upper Specification Limit, LSL is the Lower Specification Limit, and \( \sigma \) is the process standard deviation. A higher Cp indicates a more capable process relative to its specification limits.
Core Lean Six Sigma Tools and Techniques
Beyond the DMAIC structure, Lean Six Sigma utilizes a wide array of tools. Here's a summary of some frequently used ones:
| Tool/Technique | Description | Primary Use | Associated Philosophy |
|---|---|---|---|
| Value Stream Mapping (VSM) | A visual tool to map the flow of materials and information from supplier to customer, identifying waste and delays. | Analyzing and improving the entire process flow. | Lean |
| 5S System | A workplace organization method (Sort, Set in Order, Shine, Standardize, Sustain) to create a clean, orderly, and efficient environment. | Reducing waste related to motion, waiting, and defects; improving safety. | Lean |
| Kanban | A scheduling system for lean and just-in-time (JIT) production, often using visual signals to trigger action. | Managing workflow, preventing overproduction, reducing inventory. | Lean |
| Root Cause Analysis (RCA) | Techniques like Fishbone Diagrams (Ishikawa) and 5 Whys used to identify the fundamental causes of a problem. | Problem-solving, ensuring solutions address actual causes, not symptoms. | Six Sigma / Lean |
| Statistical Process Control (SPC) | Using control charts to monitor process performance over time, distinguish common cause from special cause variation, and maintain stability. | Monitoring and controlling processes, sustaining improvements. | Six Sigma |
| Pareto Chart | A bar chart showing frequency of causes, ordered from highest to lowest, highlighting the "vital few" causes (80/20 rule). | Prioritizing problems or causes for focus. | Six Sigma |
| Design of Experiments (DOE) | A statistical method for planning, conducting, analyzing, and interpreting controlled tests to evaluate factors influencing outcomes efficiently. | Optimizing processes, identifying key input variables. | Six Sigma |
| Poka-Yoke (Mistake-Proofing) | Designing processes or devices that prevent errors from occurring or make them immediately obvious. | Preventing defects, improving quality and safety. | Lean |
This table highlights just a few key tools. A Lean Six Sigma practitioner typically learns a much broader set depending on their certification level and project needs.
Visualizing Lean Six Sigma Concepts
Mindmaps can help visualize the interconnected components of Lean Six Sigma. This mindmap outlines the core elements of the methodology:
Value, Value Stream, Flow, Pull, Perfection"] id1a3["Tools: VSM, 5S, Kanban, Kaizen"] id1b["Six Sigma"] id1b1["Focus: Variation & Defect Reduction"] id1b2["Key Principles:
Customer Focus, Data-Driven, Process Management"] id1b3["Goal: 3.4 DPMO"] id2["Methodology: DMAIC"] id2a["Define
(Problem, Goals, Scope)"] id2b["Measure
(Baseline Data, Validate Measurement)"] id2c["Analyze
(Identify Root Causes)"] id2d["Improve
(Develop & Implement Solutions)"] id2e["Control
(Sustain Gains, Monitor)"] id3["Key Tools & Techniques"] id3a["Statistical Tools (SPC, DOE, Hypothesis Testing)"] id3b["Process Analysis (Process Mapping, SIPOC)"] id3c["Waste Reduction (8 Wastes, Poka-Yoke)"] id3d["Organizational Tools (Project Charter, Control Plan)"] id4["Certification Levels (Belts)"] id4a["White/Yellow (Awareness)"] id4b["Green (Project Team Member/Leader)"] id4c["Black (Project Leader, Mentor)"] id4d["Master Black (Strategist, Trainer, Mentor)"] id5["Organizational Benefits"] id5a["Improved Quality & Reliability"] id5b["Reduced Costs & Waste"] id5c["Increased Efficiency & Speed"] id5d["Enhanced Customer Satisfaction"] id5e["Data-Driven Culture Shift"]
This mindmap illustrates how the philosophies, methodology, tools, roles, and benefits integrate within the Lean Six Sigma framework.
Lean vs. Six Sigma: A Comparative Focus
While Lean Six Sigma integrates both methodologies, Lean and Six Sigma have distinct primary focuses. This radar chart visualizes the relative emphasis of each approach across key operational dimensions. Note that both contribute to all areas, but their core strengths differ.
As the chart illustrates, Lean excels in areas like speed, waste elimination, and flow, while Six Sigma's strengths lie in defect reduction, variation control, and statistical analysis. Lean Six Sigma leverages both for comprehensive improvement.
Lean Six Sigma Certification Levels (Belts)
Similar to martial arts, Lean Six Sigma proficiency is often recognized through a "Belt" system, indicating different levels of expertise and responsibility.
- White Belt: Provides a basic awareness of Lean Six Sigma concepts. White Belts understand the terminology and objectives but typically don't participate directly in projects.
- Yellow Belt: Possesses a foundational understanding of Lean Six Sigma principles and the DMAIC process. Yellow Belts often participate as core team members or subject matter experts on projects led by Green or Black Belts.
- Green Belt: Trained in the DMAIC methodology and capable of leading smaller-scoped improvement projects, often under the guidance of a Black Belt. They have a good understanding of Lean Six Sigma tools and data analysis techniques.
- Black Belt: Highly trained experts who lead complex improvement projects, mentor Green Belts, and contribute significantly to the organization's Lean Six Sigma strategy. They possess advanced statistical analysis skills and project management capabilities.
- Master Black Belt: The highest level, responsible for developing Lean Six Sigma strategy, mentoring Black Belts and Green Belts, providing technical expertise, managing project portfolios, and training others within the organization.
Training and certification are available through various organizations, universities, and online platforms. Many resources, including free training manuals and introductory courses, are available online (e.g., from the Council for Six Sigma Certification or GoLeanSixSigma.com) to help individuals begin their learning journey.
Implementation and Benefits
Successfully implementing Lean Six Sigma requires more than just training individuals; it involves strategic deployment and fostering a culture of continuous improvement.
Steps for Implementation:
- Leadership Commitment: Secure buy-in and active support from senior management.
- Strategic Alignment: Link improvement projects to the organization's strategic goals.
- Infrastructure Development: Establish roles (Champions, Belts), training programs, and project selection processes.
- Project Execution: Conduct projects using the DMAIC methodology.
- Results Tracking & Monitoring: Measure the impact of projects and implement control plans.
- Knowledge Sharing & Replication: Share successes and lessons learned across the organization.
- Cultural Integration: Embed continuous improvement thinking into daily operations.
Benefits of Lean Six Sigma:
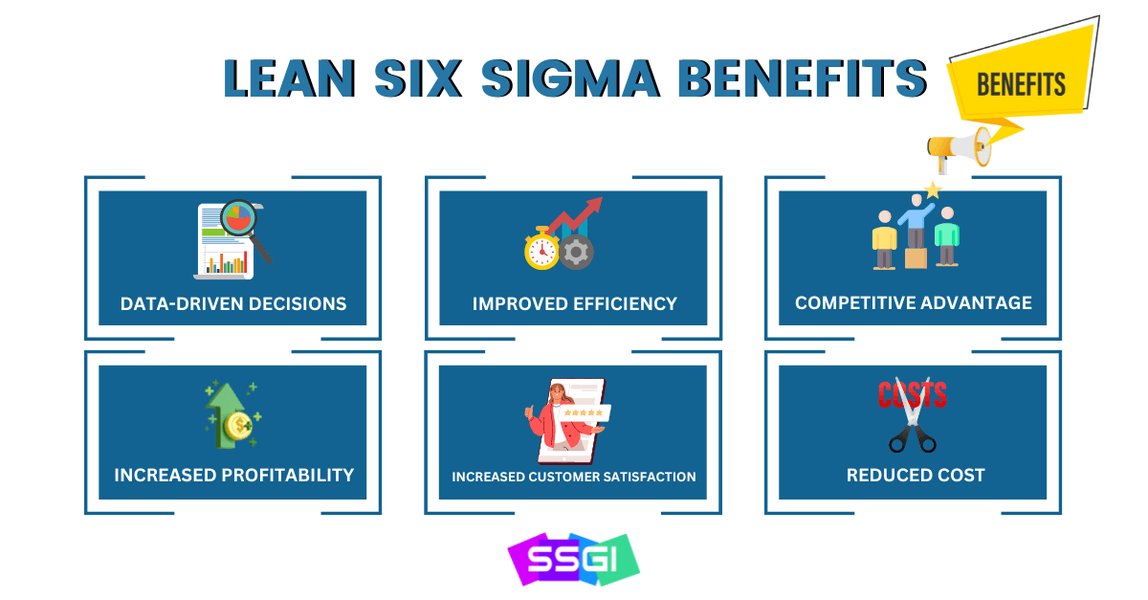
Lean Six Sigma delivers a wide range of tangible business benefits.
- Cost Reduction: Through eliminating waste and reducing defects/rework.
- Improved Quality & Reliability: By minimizing process variation and errors.
- Increased Efficiency & Productivity: By streamlining processes and reducing cycle times.
- Enhanced Customer Satisfaction: Through better quality products/services and faster delivery.
- Improved Employee Morale: By involving employees in improvement efforts and removing frustrations.
- Data-Driven Decision Making: Fostering a culture based on facts and analysis rather than assumptions.
Lean Six Sigma in Action
Understanding how Lean Six Sigma works in practice can be very insightful. This video provides a concise overview of the methodology:
Video explaining the core concepts of Lean Six Sigma in under 8 minutes.
This short video effectively summarizes what Lean Six Sigma is and how its core principles translate into practical business improvements, reinforcing the concepts discussed in this tutorial.
Frequently Asked Questions (FAQ)
What is the main difference between Lean and Six Sigma?
While often used together, they have different primary focuses. Lean concentrates on eliminating waste (non-value-added activities) and improving process speed and flow. Six Sigma concentrates on reducing defects and minimizing variation in processes through statistical analysis and structured problem-solving (DMAIC). Lean Six Sigma combines both to tackle efficiency and quality simultaneously.
Is Lean Six Sigma only applicable to manufacturing?
No. While Lean Six Sigma originated in manufacturing (Toyota for Lean, Motorola for Six Sigma), its principles and tools are highly adaptable and widely used across various sectors, including healthcare, finance, IT, government, retail, logistics, and other service industries. Any organization with processes can benefit from applying Lean Six Sigma.
What does "3.4 Defects Per Million Opportunities (DPMO)" mean?
DPMO is a key metric in Six Sigma used to measure process performance. A Six Sigma level process is one that produces fewer than 3.4 defects for every million opportunities for a defect to occur. An "opportunity" is any chance for a defect or error to happen in a product or process step. Achieving this level signifies extremely high quality and process control (99.99966% performance).
Do I need statistical knowledge to learn Lean Six Sigma?
The level of statistical knowledge required depends on the certification belt. White and Yellow Belts require minimal statistical understanding. Green Belts need a solid grasp of basic statistics and data analysis tools used within DMAIC. Black Belts and Master Black Belts require more advanced statistical knowledge, including hypothesis testing, regression analysis, and Design of Experiments (DOE). Training programs typically cover the necessary statistical concepts for each level.
Recommended Next Steps
To deepen your understanding, consider exploring these related topics:
- How do Value Stream Mapping and Process Mapping differ in Lean Six Sigma?
- What are some successful examples of Lean Six Sigma in the healthcare industry?
- Can you explain the Design of Experiments (DOE) technique used in Six Sigma projects?
- What is the role of leadership commitment in a successful Lean Six Sigma deployment?
References
This tutorial was synthesized using information from various sources, including:

 cdn.bookey.app
Last updated May 4, 2025