
Unlock Market Secrets: How the ICT Strategy Uses Candlesticks to Reveal Institutional Moves
A beginner-friendly guide to understanding price action through the lens of Inner Circle Trader concepts and candle patterns.
Highlights: Key Takeaways on ICT and Candlesticks
- Context is King: ICT strategy uses candlestick patterns not as standalone signals, but as confirmations within the broader context of market structure, liquidity, and institutional order flow.
- Focus on "Smart Money": The core idea is to identify where large institutions (Smart Money) are likely to act, often indicated by specific price action patterns around liquidity pools and imbalances.
- Beyond Basic Patterns: ICT introduces concepts like Order Blocks, Fair Value Gaps, and Liquidity Sweeps, interpreting candle formations like engulfing bars or long wicks in relation to these specific market phenomena.
Unveiling the Inner Circle Trader (ICT) Methodology
Beyond Standard Technical Analysis
The Inner Circle Trader (ICT) methodology, developed by Michael J. Huddleston, offers a unique perspective on analyzing financial markets. It diverges from traditional technical analysis that might heavily rely on indicators or isolated chart patterns. Instead, ICT focuses purely on price action, market structure, and understanding the probable actions of large institutional players – often referred to as "Smart Money".
The fundamental premise is that market movements are not random but are often engineered by these large entities to accumulate positions or trigger stop losses before initiating significant price moves. By learning to identify the footprints of this institutional activity through specific price patterns and concepts, traders aim to align their trades with the anticipated direction of the market's dominant forces.
The Building Blocks of ICT: Key Concepts Explained
Before diving into how candlestick patterns are used, it's crucial to understand the core concepts that form the foundation of the ICT strategy. These concepts provide the necessary context for interpreting price action.
Understanding Market Structure and Liquidity
Swing Highs and Lows
These are significant turning points in price. Identifying recent and relevant swing highs and lows helps define the current market structure (is the market trending up, down, or consolidating?) and potential areas where price might react.
Liquidity Pools (Buy-side & Sell-side)
Liquidity refers to areas on the chart where a large number of orders are likely clustered. Buy-side liquidity typically rests above old swing highs (where traders might have buy stop orders or profit targets), and sell-side liquidity rests below old swing lows (where sell stop orders might be placed). ICT posits that markets are drawn to these liquidity pools.
Liquidity Sweeps (Stop Runs / Manipulation)
A liquidity sweep occurs when price briefly moves beyond a key swing high or low, triggering the orders resting there (the liquidity pool), only to quickly reverse direction. This is often seen as a manipulation tactic by larger players to gather orders before moving price in their intended direction.
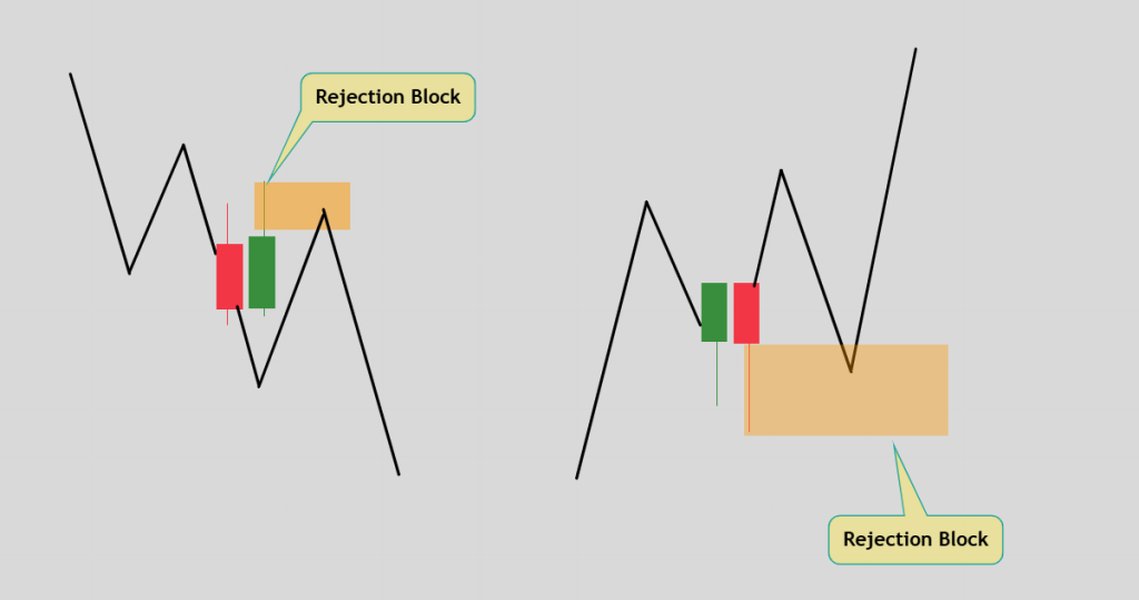
Example illustrating how price might wick above/below key levels, forming rejection blocks or sweeping liquidity.
Identifying Institutional Footprints
Order Blocks (OBs)
An Order Block is typically defined as the last up candle before a significant down move, or the last down candle before a significant up move. These candles are believed to represent areas where institutions placed large orders. Price often revisits these levels, offering potential entry points.
Visual representation of an ICT Order Block concept.
Fair Value Gaps (FVGs) / Imbalances
An FVG, also known as an imbalance, is typically a three-candle formation where there is a gap between the wick of the first candle and the wick of the third candle. This signifies a rapid, inefficient price move, often driven by institutional orders. ICT suggests that price is likely to return to "rebalance" or fill this gap in the future, making FVGs potential targets or entry zones.
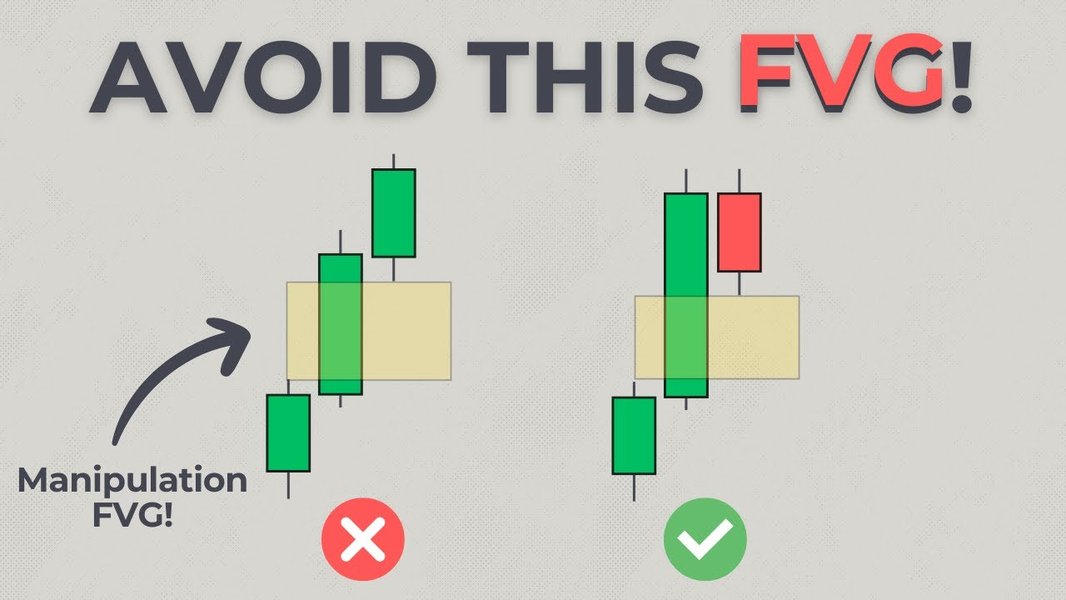
Illustrative example showing a price imbalance or Fair Value Gap.
Displacement Moves
Displacement refers to a strong, energetic price move characterized by large-bodied candles moving decisively in one direction. Displacement often occurs after a liquidity sweep and typically leaves behind Order Blocks or Fair Value Gaps, indicating strong institutional participation.
Market Structure Shifts (MSS)
An MSS occurs when price breaks a recent, significant swing high (in a downtrend) or swing low (in an uptrend), suggesting a potential change in the market's direction. This often happens after a liquidity sweep and is confirmed by displacement.
Timing and Entry Refinements
Optimal Trade Entry (OTE)
OTE refers to specific retracement levels, often derived using Fibonacci tools (typically between 61.8% and 78.6% retracement of a significant price swing), within a Fair Value Gap or testing an Order Block. It aims to provide a high-probability entry point after an initial move.
ICT Killzones (Time-based opportunities)
ICT emphasizes specific times of the day when volatility is expected to increase and high-probability setups often form, typically coinciding with the opening hours of major financial centers (e.g., London Open, New York Open). Trading during these "Killzones" is a key part of some ICT strategies.
Power of 3 (Accumulation, Manipulation, Distribution - AMD)
This concept describes a typical daily or weekly price cycle: Accumulation (consolidation), Manipulation (a false move, often a liquidity sweep), and Distribution (the main price trend for the period). Recognizing this pattern helps anticipate potential market direction.
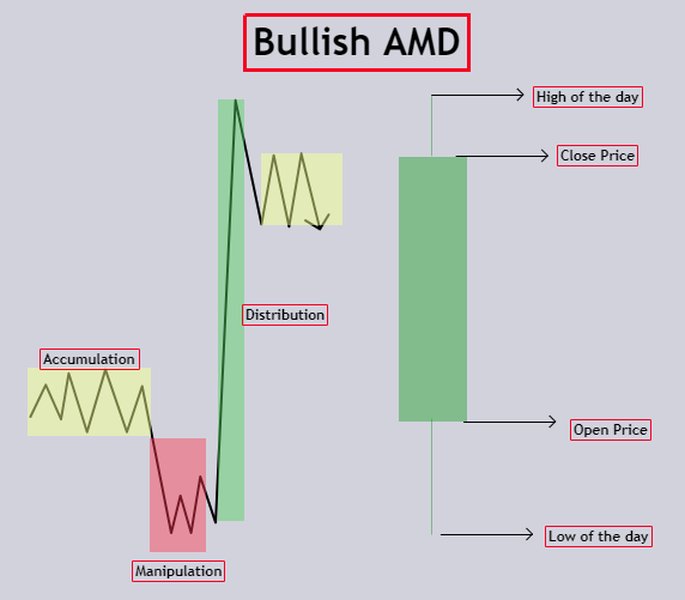
Diagram illustrating the Bullish Accumulation, Manipulation, and Distribution cycle (Power of 3).
Candle Range Theory (CRT)
Derived from ICT principles, CRT focuses on analyzing the range (high, low, open, close) of individual candles and their relationship to the broader market context, such as session opens or liquidity levels, to understand price dynamics and potential future moves.
Reading the Tape: How Candlesticks Fit into ICT
Candlesticks as Contextual Clues, Not Isolated Signals
In the ICT framework, candlestick patterns are vital, but their interpretation differs significantly from traditional technical analysis. Instead of looking for patterns like "Doji" or "Hammer" in isolation and trading them directly, ICT uses them as confirmation signals within the context of the previously discussed concepts (Market Structure, Liquidity, OBs, FVGs, etc.).
A core principle highlighted is that down candles should ideally support price moving higher, and up candles should support price moving lower. This means looking at how candles react at key ICT levels (like Order Blocks or FVGs) rather than just their color or shape. Furthermore, ICT often involves viewing consecutive candles of the same direction as representing a single, larger move on a higher timeframe, simplifying the analysis of momentum and displacement.
Key Candlestick Formations in ICT Context
Liquidity Sweep Candles (Stop Hunt Candles)
These candles often feature prominent wicks that extend beyond a previous swing high or low. A long upper wick piercing an old high followed by a close lower suggests a grab of buy-side liquidity and potential reversal down. Conversely, a long lower wick piercing an old low followed by a close higher suggests a sell-side liquidity sweep and potential reversal up. These are often referred to as rejection blocks.
Order Block Candles
The specific candle identified as the Order Block (e.g., the last down candle before a strong up move) is itself a key candlestick formation. Traders watch how price interacts when it returns to this candle's range (its high, low, open, close, or midpoint/mean threshold).
Engulfing Patterns
A bullish or bearish engulfing pattern gains significance in ICT when it occurs at a key level. For example, a bearish engulfing candle forming after price sweeps buy-side liquidity and rejects from an Order Block strongly suggests a Market Structure Shift and potential downward move.
Inside Bars
An inside bar (a candle whose range is fully contained within the previous candle's range) often signals consolidation or a pause in momentum. In ICT, this can occur after an initial displacement move, potentially forming part of an inducement pattern before the next leg, or indicating a point of equilibrium before a continuation.
Fair Value Gap (FVG) Related Candles
The candles that create an FVG (the first, gapping, and third candle) are important. The presence of large-bodied candles creating the gap signifies displacement. How future candles react when they trade back into the FVG provides clues – do they respect it and reverse, or slice through it?
Rejection Blocks / Wicks (Hammers, Shooting Stars)
Patterns like Hammers (bullish rejection of lower prices) or Shooting Stars (bearish rejection of higher prices) are interpreted based on where they form. A Hammer appearing at a bullish Order Block or after sweeping sell-side liquidity is a much stronger signal within ICT than one appearing in isolation.
Visualizing the Flow: ICT Concepts in Action
Interactive Concept Map
Understanding how these ICT concepts interconnect is crucial. The mindmap below illustrates the typical flow and relationship between key elements, culminating in trade identification where candlestick patterns provide confirmation.
Comparing Key ICT Elements
Different ICT elements offer various strengths in analysis and trade setup identification. The radar chart below provides a comparative perspective on several key concepts based on characteristics like their typical frequency, the clarity of the signal they provide, and their potential for precise entries. Note that this is an interpretive analysis rather than hard data.
Putting It All Together: A Step-by-Step ICT Trade Example
Let's walk through a hypothetical bearish trade setup using the ICT concepts and candlestick confirmations. We'll use a simplified example to illustrate the process. Imagine analyzing the EUR/USD chart.
1. Identify Higher Timeframe Context (Market Structure, Bias)
Assume the Daily chart shows a downtrend, suggesting a bearish bias. On the 4-Hour chart, price has recently rallied into a key resistance area or a bearish Order Block.
2. Pinpoint Key Liquidity Levels (Draw on Liquidity)
Identify a recent swing high on the 1-Hour or 15-Minute chart within the HTF resistance zone. This swing high represents buy-side liquidity (BSL).
3. Wait for a Liquidity Sweep (Manipulation)
Observe price pushing just above the identified swing high. This move might form a candle with a long upper wick (like a Shooting Star or Rejection Block), indicating it grabbed the BSL.
4. Look for a Market Structure Shift (MSS) with Displacement
After the sweep, watch for price to aggressively trade lower, breaking below a recent significant swing low on the lower timeframe (e.g., 15-Min). This break constitutes the MSS. Look for large-bodied red candles (displacement) confirming the shift in momentum.
5. Identify High-Probability PD Arrays (FVG, OB)
The displacement move likely created a Fair Value Gap (FVG) or left behind a new bearish Order Block (the last up candle before the aggressive down move) near the MSS level.
6. Refine Entry using OTE and Candlestick Confirmation
Wait for price to retrace back up towards the newly formed FVG or Bearish OB. Look for an entry within the Optimal Trade Entry (OTE) zone (e.g., 61.8%-78.6% Fibonacci retracement of the displacement move). As price tests the FVG/OB, look for candlestick confirmation: a Bearish Engulfing pattern, another rejection wick, or an inside bar followed by a breakdown candle.
7. Set Stop Loss and Take Profit Levels
Place the stop loss logically above the swing high created during the liquidity sweep, or above the Bearish OB being tested. Target opposing liquidity pools (e.g., recent swing lows below the entry) or higher timeframe objectives.
This table summarizes the key stages and confirmations for our hypothetical bearish setup:
| Step | ICT Concept | Description | Potential Candlestick Signal |
|---|---|---|---|
| 1 | HTF Bias | Overall market direction is bearish (Daily/4H). | N/A (Contextual) |
| 2 | Liquidity Target (BSL) | Identify recent swing high near HTF resistance. | N/A (Structural Point) |
| 3 | Liquidity Sweep | Price pierces the swing high, grabbing BSL. | Long upper wick candle (Rejection Block/Shooting Star). |
| 4 | Market Structure Shift (MSS) | Price breaks below a recent swing low aggressively. | Large-bodied bearish candles (Displacement). |
| 5 | PD Array Identification | Locate FVG or Bearish OB created by displacement. | Gap between candle wicks (FVG) or last up candle before drop (OB). |
| 6 | Entry Refinement | Price retraces to FVG/OB within OTE zone. | Bearish Engulfing, rejection wick, or Inside Bar at FVG/OB. |
| 7 | Risk Management | Set SL above manipulation high, target SSL. | N/A (Trade Management) |
Deep Dive: Watch ICT Concepts Explained
Visual learning can be incredibly helpful. This video provides a comprehensive overview and aims to simplify core ICT concepts, offering another perspective on how to approach this trading methodology. Watching explanations can help solidify your understanding of the flow between market structure, liquidity, and price action patterns.
Video explaining ICT concepts for easier understanding.
Mastering the Craft: Important Considerations
The Role of Time and Session (Killzones)
ICT heavily emphasizes the time of day. Specific strategies like the "Silver Bullet" are designed for particular one-hour windows during major market opens (London, New York). Understanding session timings and expected volatility patterns during Killzones is crucial for applying many ICT setups effectively.
Psychology and Patience
ICT requires significant patience. High-probability setups according to the model may not occur frequently. It involves waiting for the market to reach specific price levels, perform anticipated manipulations, and then show clear confirmation signals. Resisting the urge to trade outside of the plan is key.
Backtesting and Practice
Mastery comes through practice. Use charting platforms (like TradingView) to go back through historical price data (backtesting). Identify past examples of liquidity sweeps, MSS, FVGs, and OBs. See how price reacted and how candlestick patterns provided confirmation. You can practice on historical data ("fake charts" in the sense they are past data) before trading live ("real charts").
Risk Management is Crucial
No trading strategy is foolproof. Always apply strict risk management principles. Define your stop loss before entering a trade, determine appropriate position sizing based on your risk tolerance, and have clear take-profit objectives.
Frequently Asked Questions about ICT & Candlesticks
What's the difference between ICT and traditional candlestick patterns?
Is ICT the same as Smart Money Concepts (SMC)?
Can ICT strategies be used on any timeframe?
What are the most important candlestick patterns in ICT?
Explore Further
- Learn how to precisely identify ICT Order Blocks and Fair Value Gaps on your charts.
- Discover how the ICT Power of 3 (AMD) cycle plays out on daily charts with examples.
- Get a detailed walkthrough of the time-based ICT Silver Bullet strategy for short-term trading.
- Understand the key differences between trading with ICT concepts versus traditional support and resistance.
References

Last updated May 6, 2025