
Unlock the Mystery of Linear Regression: Your Step-by-Step Guide Starts Now!
Demystifying data science one simple concept at a time. Let's begin with the basics.
Highlights: Your First Steps into Linear Regression
- Straight-Line Simplicity: Linear Regression fundamentally uses a straight line to understand and predict how one thing changes concerning another.
- Identifying the Outcome: The 'Dependent Variable' is the main thing you're trying to predict or explain (like sales amount).
- Understanding the Influencer: The 'Independent Variable(s)' are the factors you believe influence the outcome (like advertising spend).
What is Linear Regression Fundamentally?
Before we dive into specific terms, let's get a general idea. Linear Regression is a cornerstone technique in statistics and machine learning. It's used to understand and quantify the relationship between different factors or variables. Imagine you have a collection of data points plotted on a graph – like house sizes versus their prices. Linear regression helps you draw the single straight line that best captures the overall trend in that data. This line can then be used to make predictions, such as estimating the price of a house based on its size.
Think of it as finding the simplest possible pathway (a straight line) through a cloud of data points to see where the trend is heading.
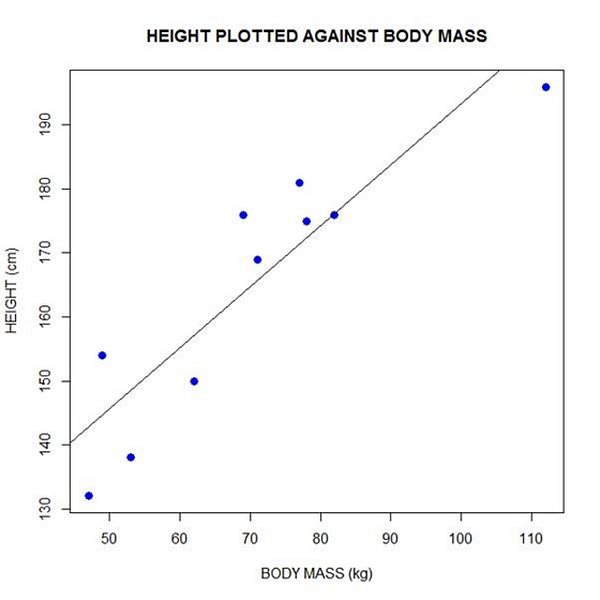
A visual example of a linear regression line fitting data points.
Let's Break Down the Jargon: Micro-Chunk 1
Alright, let's tackle the first set of terms as requested. We'll break down "Linear," "Regression," and the key variables involved.
1. Term: Linear
- (a) Literal meaning: Relating to, resembling, or arranged in a straight line.
- (b) Plain-word meaning in this context: The model assumes the connection between the factors we're studying can be represented visually as a straight line on a graph. No curves, just straight.
- (c) Why that name makes sense: The core idea is that changes in one variable correspond to proportional changes in another, creating a straight-line pattern. It directly describes the shape of the relationship being modeled.
- (d) One-word or compact-phrase substitute: Straight-line, direct.
Note: Since "Linear" directly relates to the everyday concept of a straight line (like drawing one on paper or walking a straight path), we'll consider its basic meaning understood and won't break it down further unless you ask!
2. Term: Regression
- (a) Literal meaning: The act of going back or returning to a previous state or condition.
- (b) Plain-word meaning in this context: It's a statistical process for estimating or predicting the relationship between variables. We're trying to find the average or typical relationship – how one variable tends to change when another does. It's about "predicting back" from known data.
- (c) Why that name makes sense: The term originates from Francis Galton's studies on heredity, where he observed that characteristics of descendants tended to "regress" toward the average of the population. In statistics, it evolved to mean modeling the relationship between variables, essentially finding the line that represents the average tendency or "return" point for the outcome variable based on the input variable(s).
- (d) One-word or compact-phrase substitute: Prediction, estimation, relationship modeling.
Putting it together: Linear Regression
Combining "Linear" and "Regression" gives us **Linear Regression**: A statistical method ("regression") used to model a relationship between variables assuming that relationship follows a straight line ("linear"). It's a tool to draw the best straight line through data points to make predictions.
- Substitute: Straight-line prediction, line fitting.
The Key Players: Variables in the Equation
Linear regression works by examining how one or more variables influence another. These variables have specific names:
3. Term: Dependent Variable (often denoted as 'Y')
- (a) Literal meaning: Relying on something else for support or determination.
- (b) Plain-word meaning in this context: This is the main thing you are trying to understand, predict, or explain. It's the outcome or result. For example, if you're predicting house prices, the price is the dependent variable.
- (c) Why that name makes sense: Its value is thought to *depend* on, or be influenced by, the value(s) of other variable(s) in your analysis. Like your test score *depends* on how much you studied.
- (d) One-word or compact-phrase substitute: Outcome, response, target, result.
4. Term: Independent Variable (often denoted as 'X')
- (a) Literal meaning: Not influenced or controlled by others; self-governing. Free from the influence, guidance, or control of another or others.
- (b) Plain-word meaning in this context: These are the factors, inputs, or conditions that you believe influence or cause changes in the dependent variable. In the house price example, the size of the house (square footage) would be an independent variable.
- (c) Why that name makes sense: In the model, these variables are assumed to *not* depend on the outcome variable. They are treated as the inputs or potential causes that stand "independently" and influence the dependent variable. Think of them as the settings you adjust or observe to see their effect.
- (d) One-word or compact-phrase substitute: Predictor, input, factor, explanatory variable, regressor.
Visualizing the Core Concepts: A Mindmap
To help solidify these initial concepts, here's a mindmap showing the relationship between Linear Regression and its key components that we've just discussed:
This map illustrates how Linear Regression aims to model relationships using a straight line, relying on the interplay between the Dependent Variable (the outcome) and the Independent Variable(s) (the predictors).
Comparing Linear Regression Aspects: A Radar Chart
While we're focusing on the basics (often called Simple Linear Regression, with one independent variable), it's useful to see how it compares conceptually to its more complex sibling, Multiple Linear Regression (which uses multiple independent variables). This radar chart provides a qualitative comparison across several dimensions:
This chart suggests that Simple Linear Regression is generally easier to interpret and visualize but might have less predictive power than Multiple Linear Regression, which can account for more factors but introduces more complexity and data requirements.
Summary Table: Key Terms Explained
Here's a quick reference table summarizing the terms we've covered in this first micro-chunk:
| Term | (a) Literal Meaning | (b) Plain-Word Meaning in Context | (c) Why Name Makes Sense | (d) Substitutes |
|---|---|---|---|---|
| Linear | Relating to a straight line. | Assumes relationship follows a straight-line pattern. | Describes the geometric shape of the model. | Straight-line, direct. |
| Regression | Act of going back or returning. | Statistical method for predicting/estimating relationships. | Historical term related to "regressing" towards an average; now means modeling relationships. | Prediction, estimation, relationship modeling. |
| Dependent Variable (Y) | Relying on something else. | The main outcome/result being predicted or explained. | Its value is thought to *depend* on other variables. | Outcome, response, target. |
| Independent Variable (X) | Not influenced by others; self-governing. | The input/factor believed to influence the outcome. | Treated as standing *independently* as a potential cause or predictor. | Predictor, input, factor, explanatory variable. |
Watch and Learn: Linear Regression Basics Explained
Sometimes seeing and hearing explanations can help solidify understanding. This video provides a great conceptual overview of linear regression without getting bogged down in complex formulas, perfect for starting out:
This video reinforces the core idea of fitting a line to data and introduces concepts like residuals (the errors or distances between the data points and the line), which might be topics for future chunks!
Running Checklist
Here's where we are so far:
- [✔] Explained the overview of Linear Regression
- [✔] Broke down "Linear" (linked to everyday object: straight line)
- [✔] Broke down "Regression"
- [✔] Broke down "Dependent Variable"
- [✔] Broke down "Independent Variable"
- [ ] Future chunks could cover: Slope, Intercept, Residuals, Least Squares Method, R-squared, Assumptions of Linear Regression, etc.
Next Steps?
We've covered the absolute basics: what Linear Regression is trying to do (model straight-line relationships) and the main players involved (dependent and independent variables).
Please reply with ✅ to continue to the next micro-chunk (e.g., exploring terms like Slope and Intercept, which define the regression line itself), or ❓ if you'd like clarification on anything covered so far.
Frequently Asked Questions (FAQ)
Recommended
If you want to explore further after our chat, you might find these related searches helpful:
- Explain slope and intercept in linear regression.
- What is the difference between simple and multiple linear regression?
- How is the 'best fit' line calculated in linear regression?
- What are the main assumptions of linear regression?
References
 aws.amazon.com
Last updated April 30, 2025