
Unlocking Future Liabilities: The Power of Linear Regression in Loss Reserving
A comprehensive guide to leveraging statistical models for accurate insurance claim predictions and robust financial stability.
Key Insights into Linear Regression for Loss Reserving
- Fundamental Role: Linear regression establishes a predictable relationship between historical claims data and future liabilities, forming a cornerstone for accurate loss reserve estimation in insurance.
- Data-Driven Approach: It provides a flexible and data-driven framework that integrates various predictive variables, moving beyond traditional deterministic methods to offer deeper insights into claim development.
- Enhanced Robustness: While simple linear regression has limitations, its extension through Generalized Linear Models (GLMs) and the adoption of robust loss functions significantly enhance its ability to handle complex and skewed insurance data, leading to more reliable reserve estimations.
Loss reserving is an indispensable function within the insurance industry, focusing on the meticulous estimation of future claim payments for claims that have been incurred but not yet fully settled. This includes the crucial "Incurred But Not Reported" (IBNR) claims. The accuracy of these estimations directly impacts an insurer's financial health; insufficient reserves can lead to instability, while over-reserving can tie up vital capital inefficiently. Linear regression emerges as a powerful statistical method in this domain, providing a structured approach to analyze historical claims data and predict these future liabilities.
Understanding Loss Reserving and the Role of Linear Regression
Forecasting Unpaid Claims with Precision
At its core, loss reserving aims to project the ultimate cost of claims using patterns observed in historical data, such as paid and incurred losses over time. Linear regression models play a pivotal role by identifying and establishing a linear relationship between input variables (features) and a continuous output variable (the claim amount or loss). This allows actuaries to not only forecast future liabilities but also to understand the factors influencing claim development.
The Essence of Linear Regression in Actuarial Science
Linear regression in loss reserving is about predicting the ultimate loss based on observed development patterns. It involves collecting historical loss data, often presented in a "triangle format," where each row represents an accident year and each column represents a development year. This structured data allows for a systematic analysis of how claims evolve over time. By defining a linear model, actuaries can capture these relationships, estimate parameters, and then use the fitted model to project future losses and set appropriate reserves.
Why Linear Regression? Simplicity, Interpretability, and Flexibility
One of the primary advantages of linear regression is its simplicity and interpretability. The models are straightforward to understand, making them accessible even to non-technical stakeholders. Furthermore, linear regression offers flexibility, allowing actuaries to incorporate additional variables that might influence loss patterns, such as policy characteristics, claim types, or calendar effects. This adaptability enables a more nuanced understanding of claim dynamics compared to more rigid, deterministic methods.
Core Methodologies for Evaluating Loss Reserves with Linear Regression
A Step-by-Step Approach to Predictive Modeling
The application of linear regression in loss reserving involves a methodical process, transforming raw historical claims data into actionable insights for financial forecasting.
1. Data Preparation and Structuring: The Loss Triangle
The foundation of any regression-based loss reserving lies in preparing the historical claims data. This data is traditionally organized into a "run-off triangle," where rows represent accident years (the year a claim occurred) and columns represent development periods (time elapsed since the accident year). Each cell within this triangle contains the cumulative claim amounts (either paid or incurred) reported or settled up to that specific development period.
For linear regression, this triangle is then converted into a suitable format where the dependent variable is typically the claim amount at a specific development period, and independent variables can include development lag, accident year, calendar year, or other relevant covariates.
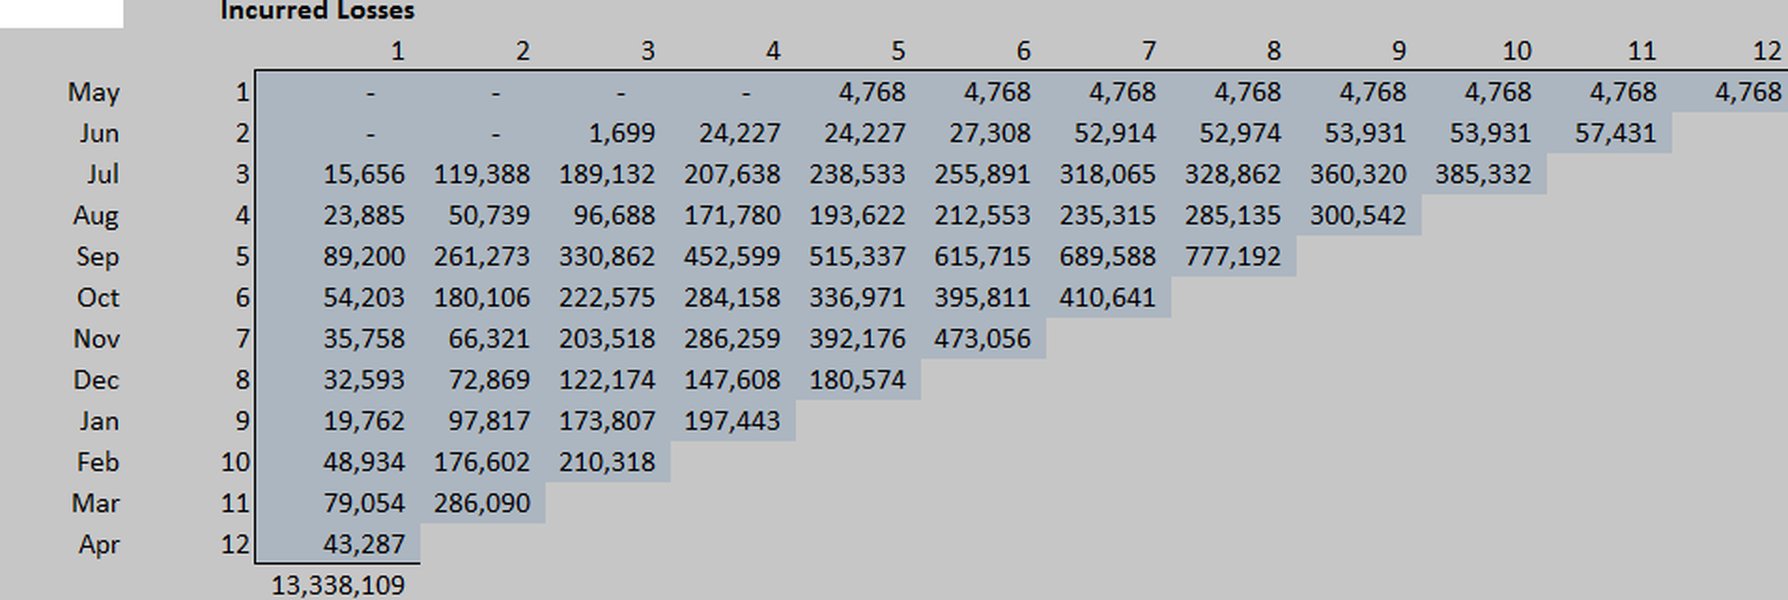
An illustration of a loss development triangle, a common data structure in actuarial science for tracking claims over time.
2. Model Specification: Defining the Relationships
Once the data is structured, the next step involves defining the linear regression model. A common approach involves using linear predictors for claim amounts or their transformations (e.g., logarithmic scale to stabilize variance). The general regression model can be expressed as:
\[ Y_{i,j} = \beta_0 + \beta_1 \times \text{Development Period}_j + \beta_2 \times \text{Accident Year}_i + \epsilon_{i,j} \]
Where \(Y_{i,j}\) represents the claim amount for accident year \(i\) at development period \(j\), \(\beta\) are the regression coefficients, and \(\epsilon_{i,j}\) is the error term. This model seeks to quantify how claim amounts evolve with respect to time and the origin year of the claims.
3. Parameter Estimation: Fitting the Model to Data
With the model specified, statistical techniques such as Ordinary Least Squares (OLS) are employed to estimate the model's parameters (the \(\beta\) coefficients). OLS works by minimizing the sum of the squared differences between the observed and predicted values, thereby finding the "best-fit" line. For non-normal claim distributions, which are common in insurance, Generalized Linear Models (GLMs) like log-linear models or Tweedie regression are often preferred due to their ability to handle various data distributions and link functions.
4. Prediction of Reserves: Forecasting Future Liabilities
After the model is fitted, it is used to predict the expected future development of claims. This includes unpaid claims within the observed accident years and for IBNR claims. Predictions are generated for each future cell in the loss triangle, providing a forward-looking estimate of required reserves.
5. Model Evaluation and Validation: Ensuring Accuracy and Robustness
Evaluating the model's performance is crucial. Metrics like R-squared, residual plots, and specialized actuarial criteria are used to assess the goodness of fit. It's important to ensure the model doesn't overfit the historical data and accurately captures underlying claim development patterns. Validation often involves comparing regression model results with those from traditional actuarial methods like the Chain-Ladder or Bornhuetter-Ferguson method, back-testing on prior years, or using hold-out samples.
Actuaries also perform diagnostics to check model assumptions, such as linearity, independence, and normality of residuals. Violations of these assumptions may necessitate the use of more advanced models, such as robust regression, or a different class of GLMs.
Addressing Challenges and Enhancing Robustness with Loss Functions
Navigating Skewed Data and Outliers in Insurance Claims
Insurance claims data often exhibit unique characteristics, such as "low frequency and high severity" events, leading to highly right-skewed distributions with a large concentration at zero. This poses challenges for standard linear regression models, particularly regarding the assumption of constant variance (homoscedasticity) and sensitivity to outliers.
Loss Functions: Tailoring the Optimization Process
When training a linear regression model for loss reserving, the choice of a loss function is critical. The loss function quantifies the difference between predicted and actual values, and the model's objective is to minimize this loss. Different loss functions handle errors and outliers differently:
- Mean Squared Error (MSE) / L2 Loss: This is the most common choice, calculating the average of squared differences. MSE heavily penalizes larger errors, making it sensitive to outliers.
- Mean Absolute Error (MAE) / L1 Loss: MAE calculates the average absolute differences. It is less sensitive to outliers than MSE, as it penalizes errors linearly.
- Huber Loss: This function combines the best aspects of MSE and MAE. It behaves quadratically for small errors (like MSE) and linearly for large errors (like MAE), offering a balance between robustness and differentiability. This makes it particularly useful for data with potential outliers.
- Log-Cosh Loss: Similar to Huber loss, Log-Cosh is a smooth loss function that is less affected by large prediction errors compared to MSE, providing another robust alternative.
The selection of an appropriate loss function depends on how the model should treat outliers and the desired level of robustness. Iterative optimization algorithms, such as gradient descent, are used to adjust model parameters to minimize the chosen loss function.
Beyond Basic Linear Regression: Advanced Techniques
To further enhance prediction accuracy and address the complexities of insurance data, several advanced techniques are often employed in conjunction with or as extensions of linear regression:
- Generalized Linear Models (GLMs): As mentioned, GLMs extend linear regression by allowing for non-linear relationships through link functions and accommodating distributions common in insurance data (e.g., Poisson, Gamma, Tweedie). This makes them ideal for modeling both claim frequency and severity.
- Lasso and Ridge Regression (Regularization): These techniques prevent overfitting, especially when dealing with a large number of predictors, by adding a penalty term to the loss function. Lasso also performs variable selection by shrinking some coefficients to zero, enhancing model interpretability.
- Robust Statistical Procedures: For data heavily impacted by outlier events, robust log-linear and ANOVA models, employing estimators like LAD, M, LMS, LTS, and MM, are used to make loss reserving estimations insensitive to these extreme values.
Comparative Analysis: Linear Regression vs. Traditional Methods
Positioning Linear Regression within the Actuarial Landscape
While linear regression offers distinct advantages, it's crucial to understand its position relative to other established actuarial methods for loss reserving. Traditional methods like the Chain-Ladder method and Bornhuetter-Ferguson method remain widely used, each with its own strengths and limitations.
The Actuarial Reserving Toolkit
Actuaries employ a diverse set of techniques to provide reasonable estimates of Incurred But Not Reported (IBNR) losses and development on known claims. The most common include:
- Chain-Ladder Method: A widely used deterministic method that projects future losses by analyzing the historical evolution of claims using "claims triangles." It's effective but assumes stable development patterns.
- Bornhuetter-Ferguson Method: Combines historical data with expected loss ratios, particularly useful for recent and unpredictable periods, reducing volatility in estimates.
- Expected Loss Methods: Rely on predefined loss ratios or frequencies to estimate reserves.
- Counts and Averages Methods: Simple methods based on average claim costs or frequencies.
- De Vylder Method: A more advanced statistical method often used for its mathematical rigor.
Linear regression, especially when extended into GLMs, provides a flexible, statistically sound, and data-driven alternative or complement to these methods. It allows for the incorporation of multiple explanatory variables and provides insights into the relationships between claim development and various predictors, which traditional methods might not explicitly model.
The following radar chart illustrates a subjective comparison of various loss reserving methods based on their perceived strengths in key actuarial evaluation criteria. Each spoke represents a different attribute, and the values indicate the relative strength of each method in that area.
A radar chart comparing various loss reserving methodologies based on key actuarial evaluation criteria.
Predicting Insurance Costs with Linear Regression in Python
A Practical Example of Linear Regression in Action
Linear regression is widely applied in various areas of insurance, not just loss reserving, but also in predicting individual insurance costs. The embedded video below offers a practical demonstration of how a linear regression model can be developed in Python to predict patient medical insurance costs based on various factors. This serves as an excellent, simplified illustration of the core principles of linear regression that are scalable to more complex loss reserving scenarios.
A tutorial on building a linear regression model in Python to predict medical insurance costs, demonstrating the practical application of the technique.
While the video focuses on medical insurance costs, the underlying principles—data preparation, model training, parameter estimation, and prediction—are directly analogous to how linear regression is used in loss reserving. In both contexts, the goal is to identify statistical relationships within historical data to make informed predictions about future financial liabilities or costs. The ability to incorporate various features (e.g., age, health conditions, policy limits) as independent variables in a linear regression model makes it a versatile tool for insurance analytics.
Key Considerations and Advantages of Linear Regression in Loss Reserving
Unlocking Deeper Insights and Better Financial Management
The application of linear regression in loss reserving offers several compelling advantages that contribute to more accurate and robust financial management for insurance companies. However, it also comes with certain considerations that actuaries must address.
Advantages of Linear Regression
| Advantage | Description |
|---|---|
| Flexibility | Linear regression allows for the incorporation of multiple explanatory variables beyond just time or accident year, such as claim types, policy characteristics, or economic indicators. This provides a richer analytical framework. |
| Interpretability | The coefficients derived from a linear regression model provide clear insights into the quantitative relationship between predictors and claim development. This transparency aids in understanding the underlying drivers of loss. |
| Extension to Modern Techniques | Linear regression forms the foundation for more advanced statistical and machine learning models, notably Generalized Linear Models (GLMs), which are highly suitable for the non-normal distributions often seen in insurance data. |
| Error Structure Modeling | The ability to analyze residuals (the differences between observed and predicted values) allows actuaries to understand and quantify the uncertainty associated with reserve estimates, leading to more informed risk assessments. |
| Data-Driven Estimates | By leveraging historical patterns and statistical rigor, linear regression helps minimize arbitrary judgments in reserve estimation, fostering more objective and data-driven financial forecasts. |
Mind Map: Factors Influencing Loss Reserve Evaluation with Linear Regression
This mind map illustrates the multifaceted factors and components involved in evaluating loss reserves using linear regression. It highlights the interplay between data, models, challenges, and advanced techniques.
Frequently Asked Questions (FAQ)
What is loss reserving in insurance?
Why is linear regression useful in loss reserving?
What are the main challenges when using linear regression for loss reserving?
How do Generalized Linear Models (GLMs) enhance linear regression in loss reserving?
Conclusion
Evaluating loss reserves using linear regression is a robust and flexible approach that leverages the power of statistical modeling to predict future insurance liabilities. By systematically analyzing historical claims data, actuaries can gain profound insights into claim development patterns, predict ultimate losses, and ensure that adequate financial reserves are maintained. While basic linear regression provides simplicity and interpretability, its extension through Generalized Linear Models (GLMs) and the strategic use of advanced loss functions significantly enhance its ability to navigate the complexities inherent in insurance data, including skewed distributions and outliers. This integration of statistical rigor with actuarial expertise enables insurance companies to make more informed decisions, fostering financial stability and efficient capital management in an ever-evolving risk landscape.
Recommended Further Exploration
- How do actuaries use machine learning for claims prediction?
- What are the differences between chain-ladder and Bornhuetter-Ferguson methods?
- Applications of Generalized Linear Models in insurance pricing.
- Understanding the impact of outliers on loss reserve estimates.