
Exploring MACD Combinations for Enhanced Trading Strategies
Discover how integrating MACD with other technical indicators sharpens market insights
Key Highlights
- Enhanced Signal Accuracy: Combining MACD with RSI, moving averages, and other indicators reduces false signals.
- Diverse Analytical Perspectives: Incorporation of volume, candlestick patterns, and trendlines supports robust market analysis.
- Customized Strategy Development: Adjust indicator combinations to suit different market conditions and timeframes.
Understanding MACD and its Limitations
The Moving Average Convergence Divergence (MACD) indicator is a widely-used momentum oscillator that helps traders identify market trends and potential reversal points by measuring the difference between two moving averages. While MACD is effective in identifying trend shifts, relying on it exclusively might lead to misinterpretation of signals. Therefore, integrating MACD with additional technical indicators is essential to confirming the validity of the signals generated and reducing the risk of false positives in trading decisions.
Integration with Complementary Indicators
1. MACD and Relative Strength Index (RSI)
Purpose and Rationale
The RSI is designed to measure the speed and change of price movements, thereby identifying overbought and oversold conditions in the market. By combining MACD with RSI, traders benefit from:
- Validation of trend shifts: When the MACD indicates a potential reversal through a bullish crossover (golden cross) or a bearish crossover (death cross), the RSI adds context by showing whether the asset is overbought or oversold.
- Enhanced entry and exit points: For example, a bullish MACD crossover paired with an RSI below 30 (suggesting oversold) strengthens the buy signal.
- Risk management: Suppressed or extreme RSI readings allow traders to avoid false signals when MACD conditions appear favorable.
2. MACD and Moving Averages
Purpose and Rationale
Moving averages filter out short-term market fluctuations and emphasize the underlying trend direction. They work in tandem with MACD in the following ways:
- Long-term validation: When MACD signals coincide with asset prices trading above a long-term moving average (such as the 200-day MA), this can be a strong indication of a bullish market. Conversely, if MACD signals align with prices below a long-term moving average, bearish trends may be confirmed.
- Crossovers as signals: Short-term moving averages (like the 50-day MA) can be combined with MACD to pinpoint more immediate trend reversals. A bullish situation may be identified when the MACD crossover occurs, and the price is trending above the moving average simultaneously.
3. MACD and Bollinger Bands
Purpose and Rationale
Bollinger Bands provide an envelope around price movements, illustrating volatility and potential support/resistance levels. When combined with MACD, they:
- Signal Confirmation: A bullish MACD crossover occurring when prices are near the lower Bollinger Band may indicate an impending upward bounce.
- Reversal Identification: Similarly, if a bearish MACD crossover appears near the upper Bollinger Band, the likelihood of a price retracement increases.
- Risk Management: The width of Bollinger Bands can help evaluate the current market volatility, guiding how aggressively one might trade based on the MACD signal.
4. MACD and Volume Analysis
Purpose and Rationale
Volume is a key indicator of market participation and momentum. Integrating volume with MACD analysis assists traders by:
- Confirming Strength: A MACD bullish crossover accompanied by an increase in trading volume provides stronger evidence of a genuine trend reversal.
- Validating Momentum: When volume declines during a bearish MACD signal, it might suggest a weakening downtrend, prompting caution in shorting.
- Screening False Signals: Low volume during MACD crossovers might indicate a lack of commitment from market participants, reducing the confidence in the signal.
5. MACD and Candlestick Patterns
Purpose and Rationale
Candlestick patterns offer visual cues regarding market sentiment and potential reversal points. When combined with MACD:
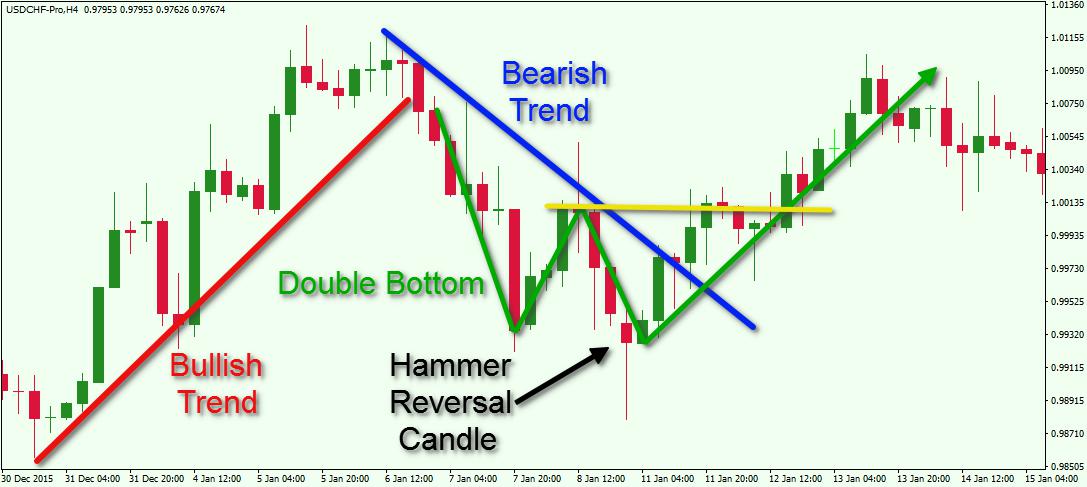
- Enhanced Entry Signals: A bullish candlestick pattern (e.g., a hammer or bullish engulfing) near a MACD golden cross may confirm a strong buy signal.
- Diversified Analysis: Recognizing bearish patterns (like a shooting star or bearish engulfing) in conjunction with a MACD dead cross further substantiates sell signals.
- Time Frame Confirmation: Analyzing candlestick formations along with MACD across different timeframes increases the reliability of the trading signal.
6. MACD and Trendlines/Support-Resistance Levels
Purpose and Rationale
Pairing MACD with trendlines or support-resistance analysis allows for an improved contextual understanding of market trends:
- Signal Reinforcement: A bullish MACD crossover occurring as the price breaks a long-standing downtrend line or support level is a strong indication of a reversal.
- Confluence for Confirmation: Integrating trendlines reduces the risk of taking a signal in a volatile market, as both indicators highlight similar market turning points.
- Dynamic Adaptation: Continuously updating trendline analysis can help traders adjust strategies in real time when paired with MACD observations.
7. MACD and Additional Oscillators (e.g., KDJ, OBV)
Purpose and Rationale
Other oscillators like KDJ (stochastic oscillators) or On-Balance Volume (OBV) provide more granularity in momentum and market volume. Combining these with MACD offers:
- Multi-Layered Confirmation: For instance, when both MACD and KDJ indicate bullish momentum simultaneously, the trading signal is more compelling.
- Enhanced Volatility Understanding: OBV helps in identifying the force behind price movements, offering an extra layer of confirmation when MACD shows trend changes.
- Integrated Strategies: Using a blend of oscillators helps extract more reliable technical signals tailored for both short-term and long-term trades.
A Comprehensive Table of MACD Indicator Combinations
| Indicator Combination | Purpose/Usage | Typical Signal Example |
|---|---|---|
| MACD + RSI | Confirms overbought/oversold conditions alongside trend reversal signs | Bullish MACD crossover with RSI below 30 indicates a strong buy signal |
| MACD + Moving Averages | Filters out short-term noise and validates trend direction | Bullish crossover when price > 200-day MA suggests continuation of an uptrend |
| MACD + Bollinger Bands | Assesses volatility and potential price retracement zones | Bullish MACD signal near the lower band indicates potential price rebound |
| MACD + Volume | Verifies the strength of price movements with trading activity | MACD bullish crossover with increased volume signals a robust trend reversal |
| MACD + Candlestick Patterns | Integrates visual market sentiment with momentum trends | A bullish engulfing pattern aligning with a MACD golden cross confirms buy action |
| MACD + Trendlines/Support-Resistance | Reinforces signals through technical chart structures | Price breaking above a resistance trendline combined with a MACD crossover indicates upward momentum |
| MACD + Additional Oscillators (e.g., KDJ, OBV) | Provides multi-dimensional analysis by combining momentum oscillators with volume metrics | KDJ confirming the MACD golden cross enhances confidence in buy signals; OBV above its moving average supports legitimacy of the trend |
Practical Application Considerations
Developing a Trading Strategy
When constructing a trading strategy using MACD alongside other indicators, traders should consider the following:
- Market Conditions: Different market regimes—be it trending or ranging—can affect the reliability of indicator signals. For instance, trending markets might benefit more from moving average confirmation, whereas oscillators like RSI and stochastic indicators can be more effective in sideways markets.
- Timeframes: The integration of MACD with other indicators should be tailored to your chosen timeframe. Short-term traders may focus on quicker oscillators while long-term traders might emphasize moving averages and volume patterns.
- Signal Weighting: Signal strength may be weighted differently based on market liquidity and volatility. It is prudent to define exit and entry criteria for each combined signal to avoid second-guessing in fast-moving markets.
- Backtesting: Prior to live trading, backtesting these combined strategies over historical data can help assess their effectiveness under various market conditions. Consistency in historical performance may reinforce the strategy’s validity.
Risk Management and Trade Confirmation
Even when multiple indicators agree, it is critical to maintain sound risk management practices. Here are some essential steps:
- Stop-loss Orders: Implement stop-loss orders based on technical levels such as moving averages or significant support/resistance zones.
- Position Sizing: Adjust trade sizes in accordance with the risk/reward ratio and market volatility.
- Multiple Confirmations: If more than one indicator (e.g., MACD, RSI, and volume) signals the same trend direction, trading confidence increases, but always monitor for market reversals via dynamic technical indicators.
- Continuous Adaptation: Market conditions change, so continuously refining and adapting the combination of indicators used based on current market trends is vital for long-term success.
Reference Links
- MACD Indicator: A Guide to Technical Analysis & Trading Signals - Familiarize
- Using MACD for Trend Analysis: A Complete Trading Guide - Tradefundrr
- Combining MACD With Technical Indicators | Forex Trading Guide - Allpips
- Best Indicators to Complement MACD - Investopedia
- How to Effectively Use MACD Indicator in Trading - StocksToTrade
Recommended Further Reading and Queries
Last updated March 25, 2025