
Unveiling Mortality Landscapes: A Comparative Look at Developed Nations
Exploring the intricate factors shaping life and death patterns across high-income countries.
Comparing mortality rates in what are often termed "first-world" or developed countries reveals a complex interplay of advanced healthcare systems, demographic shifts, lifestyle factors, and socioeconomic conditions. While the term "first-world" is an older classification, it generally refers to nations with high-income economies, robust infrastructure, and advanced technological development. This analysis delves into various metrics to provide a nuanced understanding of mortality trends in these nations as of early 2025.
Essential Insights: Key Takeaways
- Aging Populations Significantly Impact Crude Death Rates: Many developed countries have older demographic profiles, which naturally lead to higher crude death rates, even with excellent healthcare.
- Low Infant Mortality Reflects Healthcare Quality: Developed nations consistently report very low infant mortality rates, a testament to advanced maternal and child healthcare services.
- Chronic Diseases are Primary Causes of Death: Unlike developing regions, the leading causes of mortality in high-income countries are non-communicable diseases like heart disease, cancer, and stroke, often linked to lifestyle and longevity.
Understanding Mortality Metrics
To compare mortality, several key indicators are used. It's important to distinguish between them:
Crude Death Rate (CDR)
The Crude Death Rate is the total number of deaths per 1,000 individuals in a population over a specific period, usually one year. While straightforward, it's heavily influenced by the age structure of a population. A country with a larger proportion of elderly people may have a higher CDR than a country with a younger population, even if the overall health and healthcare system in the former is superior.
Developed countries generally exhibit CDRs ranging from approximately 7 to 14 deaths per 1,000 people. For instance:
- South Korea reported a relatively low CDR of around 7 per 1,000 people in 2022, reflecting its robust healthcare and comparatively younger demographic profile among developed nations.
- Germany, with a more aged population, had a CDR of about 13 per 1,000 people in 2022. This higher rate is characteristic of many European countries with significant elderly populations.
- Countries in Eastern Europe, such as Ukraine (around 18.6 per 1,000 in recent data), often show higher CDRs due to a combination of socio-economic challenges, health system pressures, and demographic factors. These are often outliers compared to other developed nations.
- Nations like Qatar (projected 1.5 per 1,000 in 2025) and the United Arab Emirates (projected 1.8 per 1,000 in 2025) exhibit exceptionally low CDRs. While not always fitting the traditional "first-world" mold, their high income, advanced healthcare, and predominantly young, often expatriate, populations contribute to these figures.
The global projected CDR for 2025 is around 7.80 per 1,000 people, offering a benchmark against which these national figures can be compared.
A world map illustrating variations in mortality rates by country.
Infant Mortality Rate (IMR)
The Infant Mortality Rate measures the number of deaths of infants under one year of age per 1,000 live births. This is a critical indicator of a nation's overall health, reflecting the quality of prenatal and postnatal care, maternal health, sanitation, and socioeconomic conditions.
Developed countries typically boast some of the lowest IMRs globally:
- Singapore stands out with one of the world's lowest IMRs, around 1.5 infant deaths per 1,000 live births, showcasing its exceptional maternal and child health services.
- Most OECD (Organisation for Economic Co-operation and Development) countries have IMRs below 5 per 1,000 live births. The OECD average was around 4.2 per 1,000 live births in 2019.
- The United States, while having a low IMR compared to global averages, tends to have a slightly higher rate (around 5.7 per 1,000 live births in 2019) than many other high-income peer countries. This points to disparities in healthcare access and outcomes within the US.
- Countries like Japan and South Korea also report very low IMRs, typically under 3 per 1,000 live births.
Life Expectancy
Life expectancy at birth is an average measure of how long a newborn is expected to live if current mortality rates continue to apply. It serves as an inverse indicator of mortality – higher life expectancy generally correlates with lower age-specific mortality rates throughout life.
Developed nations generally have the highest life expectancies:
- Japan consistently ranks among the highest globally, with a life expectancy around 85 years.
- Other countries with very high life expectancies include Switzerland (around 83.5 years), Australia (around 83.2 years), and Singapore (projected 86.7 years for 2025).
- The average life expectancy in more developed countries was around 75 years for men and 82 years for women in 2023.
- The United States has a life expectancy (around 78.4 years in 2023) that, while high globally, lags behind many other comparable developed nations. This gap is often attributed to higher rates of preventable deaths, including those from certain chronic diseases, accidents, and violence, as well as healthcare system differences.
Projections for 2025 show countries like Hong Kong aiming for life expectancies around 85.77 years, underscoring the continued impact of advanced healthcare and favorable living conditions.
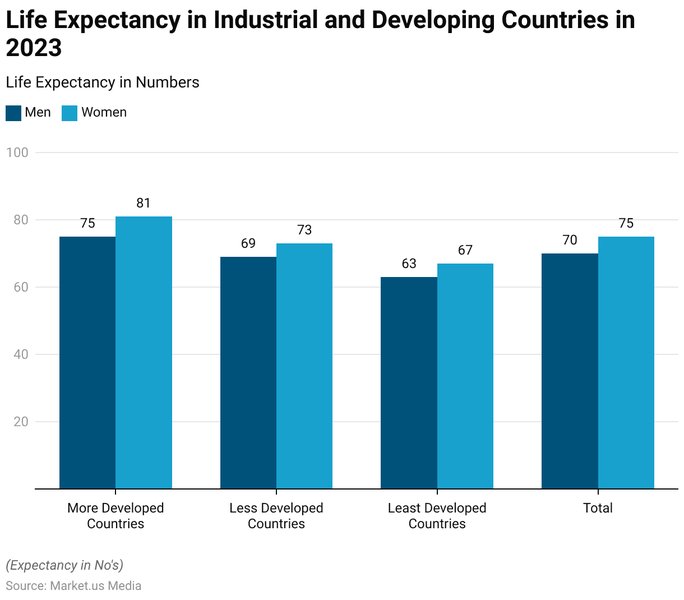
Comparison of life expectancy in industrial and developing countries, illustrating the general advantage of developed nations.
Comparative Overview of Mortality Indicators in Selected Developed Nations
The table below provides a snapshot of key mortality indicators for a selection of developed countries. It's important to note that figures can vary slightly based on the source and year of data collection; these are representative approximations based on recent data (primarily 2022-2025 projections).
| Country | Approx. Crude Death Rate (per 1,000) | Approx. Infant Mortality Rate (per 1,000 live births) | Approx. Life Expectancy (Years) | Key Notes |
|---|---|---|---|---|
| United States | 8-10 | ~5.7 | ~78-79 | Higher IMR & lower LE than some peers; health disparities exist. |
| Japan | 9-11 (influenced by aging) | <3 | ~85 | Very high LE; aging population increases CDR despite excellent health. |
| Germany | ~13 (influenced by aging) | ~3-4 | ~81 | Significant aging population; universal healthcare. |
| South Korea | ~7 | <3 | ~83 | Low CDR for a developed nation; strong healthcare system. |
| United Kingdom | 9-11 | ~3-4 | ~81 | Universal healthcare (NHS); aging population. |
| Canada | 8-9 | ~4-5 | ~82 | Universal healthcare; similar profile to other G7 nations. |
| Australia | 7-8 | ~3-4 | ~83 | High life expectancy; effective public health measures. |
| OECD Average | Varies (typically 7-13) | ~4.2 | ~80-82 | General benchmark for developed, high-income countries. |
These figures illustrate that while all these nations are "developed," there are notable variations in their mortality profiles, often linked to demographic structure, specific public health challenges, and the nuances of their healthcare systems.
Health Profile Comparison: A Visual Snapshot
The following radar chart offers a conceptual comparison of selected developed countries across several qualitative health and mortality-related dimensions. Scores are on a scale where higher values indicate better performance or lower burden (e.g., for "Chronic Disease Burden," a higher score means a lower burden). This is an illustrative representation based on general trends discussed in health literature and the provided data, not precise statistical measures.
This visualization helps to conceptualize how different developed nations might balance various strengths and challenges related to public health and mortality outcomes.
Factors Shaping Mortality Rates in Developed Nations
A multitude of interconnected factors contribute to the mortality patterns observed in high-income countries. The mindmap below illustrates these key influences:
This mindmap highlights how health outcomes are not solely dependent on healthcare spending but are also shaped by broader societal, economic, and individual factors.
Healthcare Infrastructure and Access
Nations with well-established universal healthcare systems, such as many in Western Europe, Canada, and Australia, tend to exhibit strong health outcomes. Early detection, timely treatment of diseases, and widespread access to preventative services contribute significantly to lower mortality from treatable conditions.
Lifestyle, Diet, and Chronic Diseases
Chronic non-communicable diseases (NCDs) like heart disease, cancer, stroke, and diabetes are the predominant causes of death in developed countries. These are often linked to lifestyle factors such as diet, physical inactivity, smoking, and alcohol consumption. Public health initiatives aimed at promoting healthier lifestyles play a crucial role in mitigating these risks.
Socioeconomic Conditions and Disparities
Even within wealthy nations, socioeconomic disparities can lead to significant differences in health outcomes and mortality rates. Factors such as income level, education, and access to resources can influence an individual's health behaviors, exposure to risks, and ability to access care. Addressing these disparities is a key challenge for public health.
Impact of Aging Populations
One of the most significant demographic trends in developed countries is population aging. As people live longer, the proportion of elderly individuals increases. Since mortality risk naturally rises with age, this demographic shift contributes to higher crude death rates, even if age-specific mortality rates (i.e., the risk of dying at any given age) are low or declining.
Global Context and Life Expectancy Disparities
The United States, despite its high healthcare expenditure, often presents a paradox when its life expectancy is compared to other developed nations. The following video delves into some of the reasons behind this disparity.
This video, "Why is life expectancy lower in the US than other developed countries?" by Peter Attia, explores factors such as higher rates of accidental deaths, specific chronic conditions, and systemic issues within the healthcare and societal structures that contribute to the U.S. lagging behind some peer nations in this crucial health indicator. Understanding these nuances is vital for a comprehensive comparison of mortality.
Frequently Asked Questions (FAQ)
What does "crude death rate" mean, and why is it different from age-adjusted rates?
The crude death rate (CDR) is the total number of deaths in a population over a given period (usually a year), divided by the mid-year population, and typically expressed per 1,000 people. It's a basic measure of mortality.
Age-adjusted mortality rates are statistically modified to account for differences in the age structures of populations. This allows for more accurate comparisons between groups with different age distributions. For example, a country with an older population will naturally have a higher CDR than a country with a younger population, even if the risk of death at any specific age is lower. Age-adjustment removes this demographic effect, providing a clearer picture of underlying health conditions and healthcare effectiveness.
Why do some developed countries with excellent healthcare still have relatively high crude death rates?
This is primarily due to population aging. Countries like Japan and Germany have some of the world's best healthcare systems and high life expectancies. However, they also have a large proportion of elderly citizens. Since the risk of death increases significantly with age, having more older people in the population naturally leads to a higher number of deaths annually, thus a higher crude death rate. If you look at their age-adjusted mortality rates, they are often very low, indicating excellent health outcomes for people at any given age.
What are the main causes of death in first-world countries?
In most developed countries, the leading causes of death are non-communicable diseases (NCDs). These include:
- Cardiovascular diseases (like heart attacks and strokes)
- Cancers (various types)
- Chronic respiratory diseases (like COPD)
- Diabetes
- Neurodegenerative diseases (like Alzheimer's and Parkinson's disease, which become more prevalent as populations age)
Unlike in many developing countries where infectious diseases can be major killers, in developed nations, lifestyle-related conditions and diseases associated with aging dominate the mortality landscape.
How does the USA's mortality rate compare to other developed countries?
The USA's mortality profile presents a mixed picture. While its healthcare system is technologically advanced and it spends a lot on healthcare, its overall life expectancy is lower, and its infant mortality rate is higher than many other comparable high-income countries. Factors contributing to this include higher rates of death from preventable causes such as gun violence, drug overdoses, motor vehicle accidents, and certain chronic diseases. Healthcare access and affordability issues, despite high spending, also play a role, leading to health disparities among different socioeconomic and demographic groups.
Recommended Further Exploration
- Explore the specific factors that contribute to variations in life expectancy across OECD nations.
- Investigate how different healthcare system models affect outcomes for chronic diseases in high-income countries.
- Learn more about the link between socioeconomic status and infant mortality within developed economies.
- Discover what future trends are anticipated for mortality rates as populations in developed countries continue to age.
References
Last updated May 8, 2025