
NAFLD Unveiled: How Does It Stack Up Against a Healthy Liver?
A detailed look at the distinct metabolic, lifestyle, and biological differences between individuals with NAFLD and healthy controls.
Nonalcoholic Fatty Liver Disease (NAFLD) represents a growing global health challenge, characterized by fat accumulation in the liver unrelated to significant alcohol use. Understanding the differences between individuals diagnosed with NAFLD and their healthy counterparts is crucial for recognizing risks, improving diagnosis, and developing effective management strategies. This analysis delves into the key distinctions observed across various domains.
Key Differences at a Glance
- Metabolic Mayhem: Individuals with NAFLD consistently show higher rates of insulin resistance, obesity, dyslipidemia, and metabolic syndrome compared to healthy controls, even in non-obese cases.
- Liver Alterations: NAFLD is marked by enlarged liver size (hepatomegaly) and increased liver fat content, detectable through imaging, with potential progression to inflammation (NASH) and scarring (fibrosis/cirrhosis), unlike healthy livers.
- Lifestyle & Biomarker Disparities: Compared to controls, NAFLD patients often exhibit lower physical activity levels, higher sedentary time, distinct dietary patterns (e.g., higher added sugar intake), elevated inflammatory markers, and increased oxidative stress.
Metabolic Profile: The Systemic Impact of NAFLD
More Than Just Liver Fat
One of the most striking contrasts lies in the metabolic health of individuals. NAFLD is strongly intertwined with systemic metabolic dysfunction.
Insulin Resistance and Glucose Metabolism
Compared to healthy controls, individuals with NAFLD exhibit significantly greater insulin resistance. This impaired insulin sensitivity is a cornerstone of NAFLD pathogenesis and contributes to increased fat storage in the liver. Consequently, NAFLD patients have a much higher frequency of pre-diabetes and type 2 diabetes compared to control groups.
Obesity, BMI, and Ectopic Fat
While not exclusive to overweight individuals, NAFLD is commonly associated with higher Body Mass Index (BMI) and central obesity. Studies using Magnetic Resonance Imaging (MRI) confirm that NAFLD patients have substantially higher fat content not only in the liver but often in the pancreas as well, compared to healthy controls. This ectopic fat deposition (fat stored in places other than adipose tissue) is a key differentiator.
Metabolic Syndrome and Dyslipidemia
NAFLD is often considered the hepatic manifestation of metabolic syndrome. Patients with NAFLD are far more likely than healthy controls to meet the criteria for metabolic syndrome, which includes conditions like hypertension, elevated triglycerides, low HDL cholesterol, high fasting glucose, and abdominal obesity. Dyslipidemia (abnormal blood lipid levels) is a common feature in NAFLD patients.
Lean NAFLD: A Unique Challenge
Interestingly, even individuals classified as "lean" (normal BMI) who develop NAFLD show significant metabolic abnormalities when compared to lean healthy controls. This highlights that metabolic dysfunction, rather than obesity alone, is central to the disease process.
The Liver Itself: Structural and Functional Changes
Visible Differences in Size and Composition
The liver undergoes noticeable changes in individuals with NAFLD.
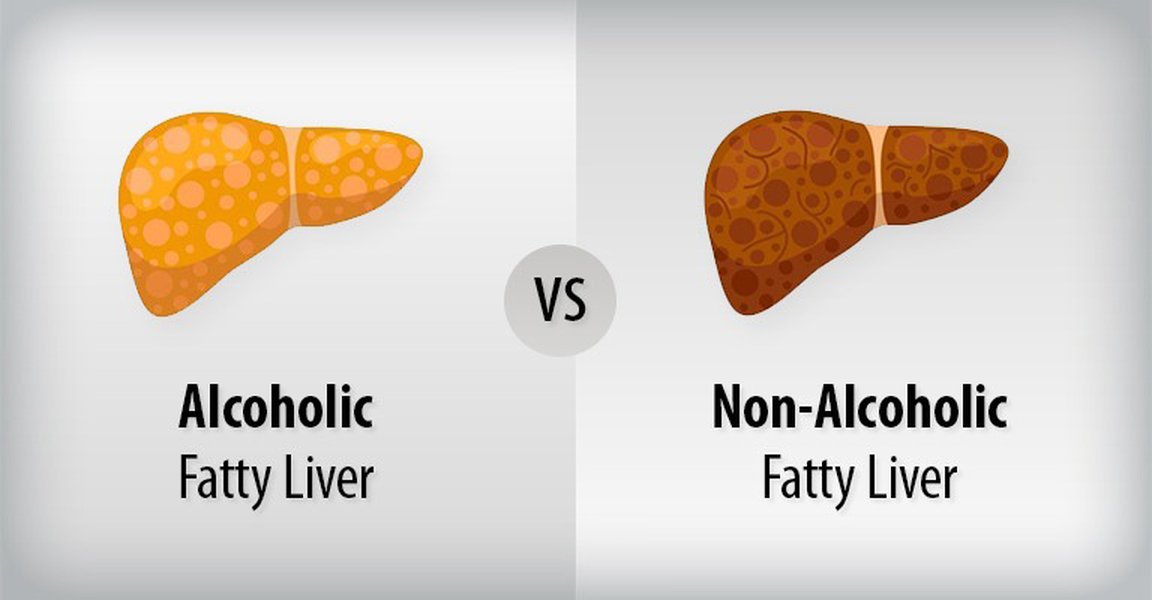
Visual comparison highlighting fat accumulation in a liver with NAFLD versus a healthy liver.
Liver Size (Hepatomegaly)
Studies consistently demonstrate that NAFLD patients have significantly larger liver volumes compared to healthy controls. Measurements often show average liver sizes around 149 mm in NAFLD patients versus approximately 134 mm in controls, indicating hepatomegaly (liver enlargement) directly related to fat infiltration within liver cells (hepatocytes).
Hepatic Steatosis and Progression
The defining feature of NAFLD is hepatic steatosis – excess fat accumulation. While healthy controls lack this, NAFLD exists on a spectrum. It can range from simple steatosis (NAFL) to nonalcoholic steatohepatitis (NASH), which involves inflammation and liver cell damage. NASH can further progress to fibrosis (scarring), cirrhosis (advanced scarring), and even hepatocellular carcinoma (liver cancer), risks not typically faced by healthy individuals.
Liver Enzymes
Liver enzyme levels, particularly Alanine Aminotransferase (ALT) and Aspartate Aminotransferase (AST), are frequently elevated in NAFLD patients compared to the normal ranges seen in healthy controls, signaling ongoing liver stress or injury.
Lifestyle Factors: Activity and Diet
Behavioral Differences Contributing to Risk
Lifestyle choices play a significant role in the development and progression of NAFLD, creating distinct patterns compared to healthy populations.
Physical Activity and Sedentary Behavior
Objective measurements reveal stark differences in activity levels. Individuals with NAFLD tend to spend significantly more time in sedentary behaviors and engage in less daily physical activity than their healthy counterparts. They often take fewer steps per day, have lower total energy expenditure, and make fewer transitions from sedentary to active states. A considerably lower percentage of NAFLD patients meet recommended physical activity guidelines compared to controls.
Dietary Patterns and Nutrient Intake
While overall dietary patterns might seem similar (often reflecting a Western diet high in fat and processed foods), specific differences emerge. NAFLD patients often report higher consumption of added sugars, particularly from sugary drinks like soft drinks and juices, compared to controls. Some studies indicate higher intake of glucose and protein but lower fiber intake per calorie. Differences in dietary cholesterol and fatty acid profiles (e.g., lower omega-3 PUFAs, higher omega-6 PUFAs) have also been observed. Furthermore, NAFLD patients may have lower intake of protective micronutrients such as vitamin K, vitamin B6, magnesium, calcium, and vitamin C compared to healthy individuals.
Biomarkers and Inflammation: The Molecular Divide
Revealing Differences at the Cellular Level
Biochemical analysis reveals significant disparities between NAFLD patients and healthy controls, pointing towards underlying inflammation and oxidative stress.
Oxidative Stress Markers
NAFLD patients exhibit significantly higher levels of oxidative stress markers, such as malondialdehyde (MDA) and conjugated dienes (CD), indicating increased lipid peroxidation and cellular damage compared to healthy volunteers. Concurrently, their antioxidant defense system appears compromised, with potentially lower levels or activity of antioxidants like reduced glutathione (GSH), glutathione reductase (GR), and superoxide dismutase (SOD).
Inflammatory Markers
A state of low-grade chronic inflammation is characteristic of NAFLD. Patients often show elevated serum levels of inflammatory markers like C-reactive protein (CRP), ferritin, and pro-inflammatory cytokines such as Tumor Necrosis Factor-alpha (TNF-alpha) and Interleukin-6 (IL-6) compared to healthy controls. This systemic inflammation is linked to the progression from simple fatty liver to NASH.
Serum Free Fatty Acid Profiles
Differences are also seen in how the body handles fats. Following an oral fat load challenge, NAFLD subjects show distinct serum free fatty acid profiles compared to controls, often with higher levels of major circulating free fatty acids like oleic and palmitic acids, and significant increases in linoleic acid. Imbalances in the n-3/n-6 fatty acid ratio are also noted.
Genetic and Molecular Biomarkers
Research using advanced techniques has identified specific genes (e.g., CEBPD, GATA3, KLF4) and serum biomolecules whose expression levels differ between NAFLD patients and healthy individuals. These biomarkers often relate to immune cell infiltration and fibrotic processes in the liver, offering potential for non-invasive diagnosis and prognosis.
Visualizing the Differences: Key Factors Compared
NAFLD vs. Healthy Control Profile
The radar chart below illustrates the typical divergence between an average individual with NAFLD and a healthy control across several key health indicators. Higher values on risk-related axes (like Insulin Resistance, Liver Fat, Oxidative Stress, Metabolic Syndrome Risk, Cardiovascular Risk) and lower values on protective axes (like Physical Activity) are characteristic of the NAFLD profile compared to the healthy control profile.
Mapping the Divergence: NAFLD vs Healthy Controls
A Mindmap Overview
This mindmap provides a visual summary of the core areas where individuals with NAFLD differ significantly from healthy controls, encapsulating the multifaceted nature of the condition.
(e.g., higher added sugar, lower fiber, micronutrient variations)"] id4["Biomarkers & Inflammation"] id4a["Increased Oxidative Stress Markers (MDA, CD)"] id4b["Compromised Antioxidant Status"] id4c["Elevated Inflammatory Markers (CRP, Ferritin, IL-6, TNF-α)"] id4d["Altered Serum Free Fatty Acid Profiles"] id4e["Distinct Genetic/Molecular Markers"] id5["Clinical Outcomes"] id5a["Increased Risk of Liver Failure/HCC"] id5b["Increased Cardiovascular Disease Risk"] id5c["Higher Overall Morbidity"]
Summarizing the Key Distinctions
Comparative Table
The following table provides a concise summary comparing typical findings in individuals with NAFLD versus healthy controls across several key domains.
| Feature | NAFLD Patient Profile | Healthy Control Profile |
|---|---|---|
| Metabolic Health | High prevalence of insulin resistance, metabolic syndrome, dyslipidemia, pre-diabetes/diabetes. Often higher BMI/central obesity. Increased pancreatic fat. | Generally insulin sensitive, lower rates of metabolic syndrome components. Lower BMI/central obesity prevalence. Normal pancreatic fat. |
| Liver Size & Fat | Enlarged liver (hepatomegaly) with significant fat accumulation (steatosis). | Normal liver size and minimal to no fat accumulation. |
| Liver Enzymes (ALT/AST) | Frequently elevated. | Typically within normal range. |
| Physical Activity | Lower levels of daily activity, higher sedentary time. Less likely to meet activity guidelines. | Higher levels of physical activity, lower sedentary time. More likely to meet guidelines. |
| Dietary Habits (General Trends) | Tendency towards higher added sugar intake (esp. sugary drinks), potentially lower fiber and certain micronutrients (Vit C, K, B6, Mg, Ca), altered fatty acid ratios (e.g., lower Omega-3). | Generally better adherence to balanced dietary patterns, lower intake of added sugars. |
| Inflammation & Oxidative Stress | Elevated systemic inflammatory markers (CRP, Ferritin, cytokines) and markers of oxidative stress (MDA, CD). Compromised antioxidant defenses. | Normal levels of inflammatory markers and oxidative stress indicators. Robust antioxidant defenses. |
| Clinical Risk | Increased long-term risk for severe liver disease (NASH, fibrosis, cirrhosis, HCC) and cardiovascular disease. | Significantly lower risk for liver disease progression and associated cardiovascular events. |
Understanding NAFLD: An Overview
Video Insight
For a foundational understanding of Nonalcoholic Fatty Liver Disease, including who is most at risk, the video below provides a concise explanation. It highlights the connection between NAFLD and conditions like obesity, diabetes, and high blood pressure, which aligns with the metabolic differences discussed earlier when comparing NAFLD patients to healthy individuals.
Frequently Asked Questions
References
- Comparison of cardiometabolic risk factors and incidence of pre-diabetes and diabetes between patients with non-alcoholic fatty liver disease and matched controls: A 10-year retrospective cohort study - Frontiers
-
Comparison of size of the liver between patients with non-alcoholic fatty liver disease and controls - NCBI PMC
- Objectively measured physical activity and sedentary behaviour in patients with non-alcoholic fatty liver disease - PubMed
-
Nutrition and physical activity in NAFLD: an overview of the epidemiological evidence - NCBI PMC
-
Comparison of oxidative stress status in patients with non-alcoholic fatty liver disease and chronic viral hepatitis - NCBI PMC
- Serum free fatty acid profile differs in NAFLD subjects and healthy individuals after an oral fat load - PubMed
- MRI-estimated pancreatic and liver fat content in healthy controls versus NAFLD patients - ResearchGate
-
Biomarkers in nonalcoholic fatty liver disease - NCBI PMC
Recommended Reading
Last updated April 24, 2025