
Spotting Daily Tops and Dips in the Nasdaq Composite
A comprehensive guide to technical strategies and indicators
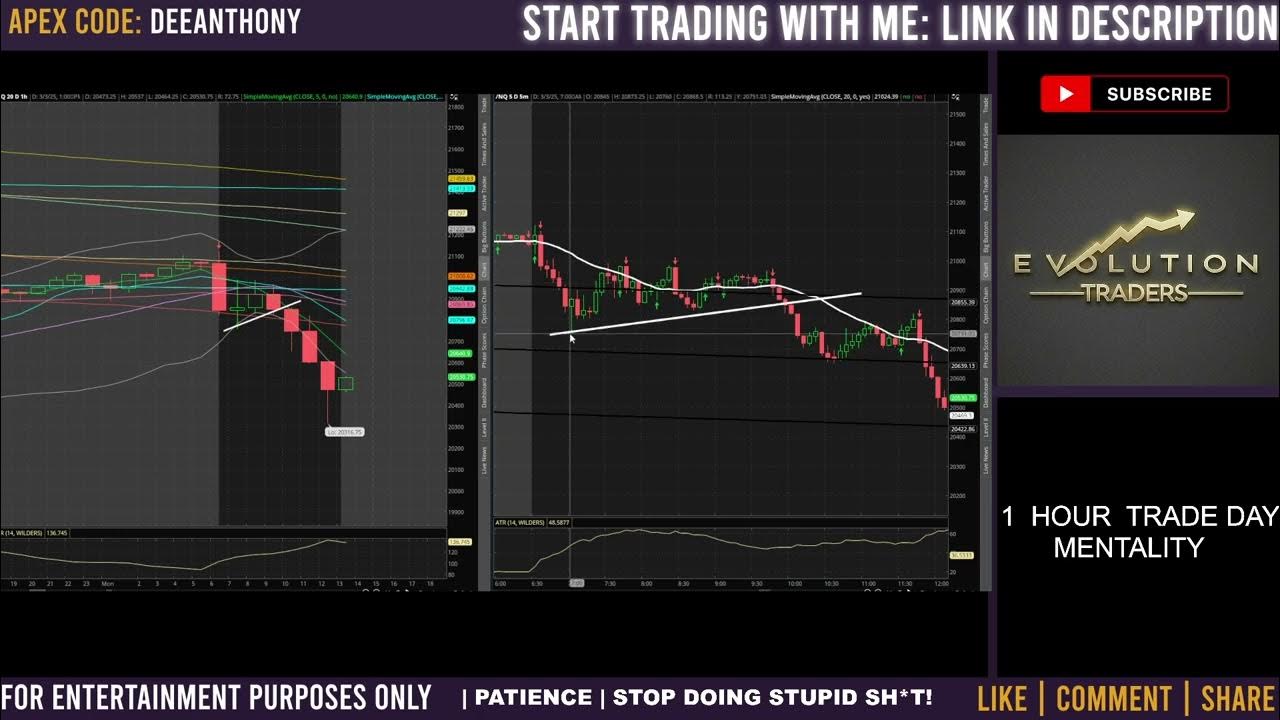
Key Insights
- Technical Indicators: Leverage moving averages, RSI, candlestick patterns, and Bollinger Bands to gauge market momentum.
- Volume & Price Action: Analyze trading volume alongside price fluctuations to understand market sentiment and potential extremes.
- Support and Resistance: Use historical price levels and distribution days to identify critical turning points.
Understanding the Nasdaq Composite and Its Dynamics
The Nasdaq Composite Index is a crucial market index that tracks the performance of over 3,000 stocks, many of which are in technology and growth-oriented sectors. Daily price fluctuations in the index can be indicative of broader market sentiment and economic trends. Spotting daily tops and dips involves careful analysis of technical indicators and an understanding of market conditions. Investors use a varied set of tools to decode whether the market is reaching new highs or experiencing a short-term reversal.
Technical Analysis Strategies
1. Price Action and Range Analysis
Tracking the daily high and low prices can offer insights into the range of the index’s movement within a single trading day. By comparing the current day’s range with historical averages, traders can spot deviations that may indicate emerging trends. For example, if the Nasdaq witnesses a particularly broad daily range, it may signal significant volatility and potential reversal points.
Daily Highs and Lows
Monitoring the daily highs and lows allows you to quickly identify if the current price is peaking near a high or bottoming near a low. A very high price relative to the usual range can indicate an overbought condition, while prices near the daily low might suggest oversold conditions. It is essential to compare these figures against previous days’ performance to spot significant anomalies.
Distribution Days
Distribution days are defined by a closing drop of at least 0.2% on higher volume days. Multiple distribution days may indicate that heavy selling pressure is building, which could be a harbinger of a market top.
2. Moving Averages
Moving averages smooth out daily price changes and help identify the underlying trend. Commonly used averages include the 50-day and 200-day moving averages:
- Short-term Moving Averages: The 50-day moving average can provide insights on the medium-term trend. A price crossing below this average on significant volume can be a signal for a dip.
- Long-term Moving Averages: The 200-day moving average is influential in determining the overall market health. A decline below this average might confirm a bearish trend.
When the index approaches these moving averages, traders should be alert to potential reversals. A crossover, where a shorter moving average falls below a longer one, is a classic technique used to spot market tops or bottoms.
3. Relative Strength Index (RSI) & Momentum Indicators
The Relative Strength Index (RSI) is a key momentum indicator that measures the speed and change of price movements. An RSI value above 70 suggests that the market may be overbought and poised for a dip, whereas an RSI below 30 indicates oversold conditions, hinting at a potential bottom.
Additional Momentum Tools
In addition to the RSI, the stochastic oscillator and other momentum indicators can be effective in confirming market conditions:
- Stochastic Oscillator: Measures the position of the closing price relative to the period’s price range. Extreme values can signal market turning points.
- Bollinger Bands: Measure volatility and help signal when prices move to extreme levels relative to the average.
Volume Analysis
Understanding Trading Volume
Trading volume is a critical factor in confirming price movement trends. High volume on up days typically indicates bullish sentiment, while high volume on down days can confirm selling pressure. The underlying concept is that volume gives context to price movements—strong trends are often accompanied by a corresponding surge in trading volume.
Interpreting Volume Spikes
Volume spikes during a downturn can be a red flag, especially if they coincide with resistance levels or the approach of key moving averages. They often signal that a market top could be imminent as large institutional investors may be selling off their positions.
Volume and Price Divergence
A divergence between volume and price action, such as the index making new highs on declining volume or new lows on lower volume, can be an indicator of weakening momentum. This divergence is essential in identifying potential reversals in market trends.
Support and Resistance Levels
Establishing Key Price Levels
Historical support and resistance levels play a significant role in technical analysis. The support level is the price at which a significant number of buyers typically step into the market, causing a rebound. In contrast, resistance levels are price points where selling tends to intensify, capping further price advances.
Analyzing Historical Data
By studying past price movements, you can identify these regions with a higher probability of acting as a floor or barrier. When a price nears a historical resistance level accompanied by declining momentum, it might be a signal that a daily top is forming. Conversely, when the price approaches a support level, it could indicate that any further dip may be supplemented by a rebound.
Application to Nasdaq Composite
For the Nasdaq Composite, several key levels can be monitored on a daily basis. Traders often look at previous day’s close, intra-day swing lows, and highs to gauge potential reversal points.
Integrating Multiple Indicators
A Holistic Approach
Relying on a single technique can lead to false signals. Consequently, integrating several methods provides a more robust analysis. Combining candlestick patterns, moving averages, RSI, volume analysis, and support/resistance levels increases the precision in identifying daily tops and dips.
Candlestick Patterns
Candlestick patterns such as the shooting star, hanging man, or morning star are visual clues that indicate potential reversals. A shooting star or hanging man at a resistance level might signal a market top, whereas a morning star formation at a support level signals a dip.
Synchronization of Indicators
When multiple indicators converge on a similar signal, the likelihood of the market reversing increases. For instance, if the RSI is above 70, price action is near a significant resistance level, and volume spikes, these combined factors heighten the probability of a top. Similarly, oversold RSI readings paired with high buying volume at support levels can indicate a dip is nearing its bottom.
Practical Application: Analyzing Today’s Data
Example Scenario for the Nasdaq Composite
Suppose the Nasdaq Composite is trading near 18,111.217 with a current trading volume reflective of recent history. By observing the following:
| Metric | Description | Indicator |
|---|---|---|
| Daily Range | High vs. Low price within the session | A broader range could signal volatility |
| Volume | Trading volume compared against average volumes | High volume during a decline may point to a top |
| Moving Averages | 50-day and 200-day averages | Crossovers indicate changing trends |
| RSI | Relative Strength Index reading | Above 70 indicates potential overbought; below 30 indicates oversold |
| Support/Resistance | Historical price levels | Key reversal zones on the chart |
Using this table as a guide, traders can effectively monitor and respond to market changes. For instance, if the price closes near its daily high, the RSI is above the 70-mark, and there is a significant volume spike, it may be a strong indication that a market top is forming. Alternatively, if the price falters near a robust support level, with an oversold RSI and diminishing volume on declines, it signals that a dip might be concluding, presenting a potential buying opportunity.
Monitoring Overall Market Sentiment
Beyond the Numbers
While technical indicators provide quantifiable data, market sentiment can often offer a qualitative measure of investor behavior. Tools such as the Advance-Decline Line (ADL) or various sentiment surveys can reinforce the technical signals you observe on the chart.
Market News and Economic Indicators
Broader economic news, such as GDP growth figures, inflation rates, and interest rate decisions, also impact the Nasdaq Composite. A combination of favorable economic news with bullish technical signals might delay or reverse an anticipated dip. Conversely, negative economic developments can add to a downtrend even if technical indicators are borderline.
Empirical Observations
Many seasoned traders recommend cross-referencing technical patterns with real-time market news. For example, if a significant distribution day is observed along with unexpected geopolitical or economic news, the market might be headed toward a more pronounced top. Investors should always combine their technical analysis with up-to-date news analysis to make informed decisions.
Risk Management and Final Considerations
Strategies for Safeguarding Investments
Even the most reliable technical indicators can sometimes generate false signals. Therefore, risk management is essential. Setting stop-loss levels, maintaining diversified positions, and not relying solely on technical indicators ensures that you are prepared for unanticipated market moves. It is advisable to combine a systematic approach with discretionary judgment based on the broader economic context.
Stop-Loss Orders and Position Sizing
Stop-loss orders can protect against rapid declines. When identifying potential tops, you might consider protecting long positions by setting stop-loss levels just below key resistance or support levels. Likewise, the use of position sizing can help manage risk if a trade does not move in the anticipated direction.
Regular Review and Adaptation
The Nasdaq Composite, like any other index, can be influenced by rapidly changing market conditions. Regularly reviewing your analysis framework and adapting your strategies based on current trends is vital. This may involve shifting emphasis between different technical indicators or even rebalancing an entire trading portfolio to accommodate evolving market dynamics.
Integrating Strategy into Daily Trading Routines
How to Incorporate These Tools Daily
When you begin your day, it is important to systematically review charts and key indicators for the Nasdaq Composite. Implement a checklist that may include:
- Checking the overnight closing data, daily highs and lows, and overall market sentiment.
- Reviewing major moving averages for possible crossovers.
- Monitoring intraday volume trends and comparing them against typical averages.
- Evaluating technical indicators like RSI for signs of overbought or oversold conditions.
- Identifying prominent support and resistance levels from historical data and the previous day’s closing prices.
Maintaining this consistency in your analysis will likely improve your ability to spot potential tops and dips, thereby making more informed decisions. Emphasizing a disciplined approach that blends technical signals with market sentiment offers a strategic advantage in a context as dynamic as the Nasdaq Composite.
References
-
NASDAQ Composite Index (COMP) Latest Quotes, Charts, Data - Nasdaq
- NASDAQ Composite (^IXIC) Stock Price, News, Quote & History - Yahoo Finance
- NASDAQ Composite Index Today (IXIC) - Investing.com
- How To Spot Major Stock Market Tops - Investors.com
- Recognizing Market Tops and Bottoms - Investor's Business Daily
Recommended Further Searches
Last updated March 7, 2025