
Unlocking NetSuite Insights: Mastering Logs for Extraction and System Health Assessment
Dive deep into NetSuite's logging capabilities, learn how to export logs, and build a powerful health monitoring tool.
NetSuite, as a comprehensive ERP system, generates a wealth of log data that tracks system activity, user actions, script performance, and data changes. Understanding and utilizing these logs is crucial for effective monitoring, troubleshooting, auditing, and maintaining the overall health of your NetSuite environment. This guide explores the different types of logs available, methods for extracting them to an external database for advanced analysis, and a blueprint for creating a custom NetSuite health assessment tool based on this valuable data.
Essential Insights
- Diverse Log Ecosystem: NetSuite offers various logs including Script Execution, Audit Trails (System Notes), Activity Logs, Error Logs, and more, each serving specific monitoring and debugging purposes.
- Flexible Log Extraction: Logs can be extracted using methods like scheduled SuiteScripts, SuiteAnalytics Connect (ODBC/JDBC), custom RESTlets/APIs, ETL tools, or native CSV exports, allowing integration with external databases.
- Proactive Health Monitoring: Extracted logs form the foundation for building a health assessment tool to monitor performance, security, data integrity, and compliance, enabling proactive issue identification and optimization.
Decoding NetSuite's Log Landscape
NetSuite provides a range of logs designed to offer visibility into different aspects of the system. Understanding these logs is the first step towards effective system management.
Key Log Categories
Script Execution Logs
Generated by SuiteScript (NetSuite's scripting language), these logs capture detailed information about the execution of custom scripts. They are indispensable for developers during debugging and for administrators monitoring script performance and resource consumption. Using the N/log module, developers can create log entries at different severity levels:
- Debug: Highly detailed messages useful during development and troubleshooting. Captures all log types.
- Audit: Records significant events or milestones within a script's execution flow.
- Error: Captures exceptions and runtime errors encountered during script execution.
- Emergency: Reserved for critical, system-impacting failures requiring immediate attention.
These logs can be viewed via the "Execution Log" tab on script deployment records or the dedicated "Script Execution Logs" page. Note that NetSuite typically retains these logs for 30 days.
Audit Trail Logs (System Notes)
Perhaps one of the most critical log types for governance and compliance, Audit Trails (often accessed via System Notes) provide a time-stamped record of changes made to NetSuite records, customizations, and configurations. They detail:
- The record or configuration item changed.
- The field that was modified.
- The old and new values.
- The user who made the change.
- The user's role at the time of the change.
- The date and time of the change.
- The type of action (Create, Update, Delete).
- The context (e.g., UI, Web Services, SuiteScript).
Audit logs are essential for tracking data modifications, security audits, and understanding system evolution.
System Logs & Activity Logs
These logs focus on background processes and specific system jobs:
- System Logs: Track the execution of background processes like scheduled scripts, Map/Reduce jobs, and workflows. They help monitor the success, failure, and performance of automated tasks.
- Activity Logs: Often associated with specific modules like Planning & Budgeting or data integrations, these logs capture details about jobs related to data loads, metadata updates, or specific search executions.
Login Audit Trail & Access Logs
Crucial for security monitoring, these logs track user login attempts, including successful logins, failed attempts, IP addresses, timestamps, and the roles used during sessions. Analyzing these logs helps identify suspicious activity or potential unauthorized access attempts.
Deleted Record Log
This specialized log provides information specifically about deleted transaction records, including who performed the deletion and when. It's vital for maintaining data integrity and auditing purposes.
Analytics Audit Trail
This log tracks changes made specifically to analytical components like saved searches, reports, and report schedules, providing visibility into how reporting and analytics configurations evolve.
Log Summary Table
The following table summarizes the primary log types and their typical use cases:
| Log Type Category | Specific Log Types / Features | Primary Use Case | Key Information Captured | Typical Retention |
|---|---|---|---|---|
| Scripting & Execution | Script Execution Logs (Debug, Audit, Error, Emergency) | Debugging custom code, performance monitoring, error tracking | Execution status, timings, custom messages, error details | 30 Days (configurable) |
| Data & Configuration Changes | Audit Trail / System Notes, Deleted Record Log, Analytics Audit Trail | Compliance, security audits, change tracking, data governance | Who, what, when, old/new values, IP address, action type | System-defined (long-term) |
| System Processes | System Logs, Activity Logs | Monitoring background jobs, scheduled tasks, integrations, specific module activities | Job status (success/failure), execution times, processed records | Varies by log/module |
| Security & Access | Login Audit Trail / Access Logs | Security monitoring, identifying unauthorized access attempts | Login success/failure, timestamps, IP addresses, user roles | System-defined |
Extracting NetSuite Logs to an External Database
While NetSuite provides interfaces to view logs, extracting them to an external database unlocks possibilities for long-term archiving, advanced analytics, correlation with other data sources, and centralized monitoring. Here are common methods:
Methods for Log Extraction
1. Scheduled SuiteScripts
This is a highly flexible approach using NetSuite's native scripting capabilities. A scheduled script can be written to:
- Query log data using NetSuite's search APIs (e.g.,
N/searchfor System Notes) or specific log APIs. - Format the retrieved log data (e.g., into JSON).
- Use the
N/httpsmodule to send (POST) the log data to an external API endpoint connected to your database.
This method offers granular control over what data is extracted and how it's processed but requires SuiteScript development expertise.
// Example snippet concept for searching audit trail logs
// Note: This is illustrative and needs error handling, pagination, etc.
require(['N/search', 'N/https'], function(search, https) {
    function extractAuditLogs() {
        var auditSearch = search.create({
            type: search.Type.SYSTEM_NOTE,
            filters: [
                // Example: Filter by date or record type if needed
                // ['date', 'onorafter', 'yesterday']
            ],
            columns: [
                'date', 'recordtype', 'recordid', 'field', 'oldvalue', 'newvalue', 'user', 'role'
                // Add other relevant columns
            ]
        });

        var logEntries = [];
        // Consider using PagedData for large result sets
        auditSearch.run().each(function(result) {
            logEntries.push({
                date: result.getValue('date'),
                recordType: result.getValue('recordtype'),
                recordId: result.getValue('recordid'),
                field: result.getText('field') || result.getValue('field'), // Get text if available
                oldValue: result.getValue('oldvalue'),
                newValue: result.getValue('newvalue'),
                user: result.getText('user'), // Get user name
                role: result.getText('role') // Get role name
            });
            // Send in batches to avoid large payloads
            if (logEntries.length >= 100) {
                sendToExternalDB(logEntries);
                logEntries = [];
            }
            return true; // Continue iteration
        });

        // Send any remaining entries
        if (logEntries.length > 0) {
            sendToExternalDB(logEntries);
        }
    }

    function sendToExternalDB(data) {
        try {
            var response = https.post({
                url: 'YOUR_EXTERNAL_API_ENDPOINT', // Replace with your actual endpoint
                body: JSON.stringify(data),
                headers: {
                    'Content-Type': 'application/json',
                    'Authorization': 'Bearer YOUR_API_KEY' // Example authorization
                }
            });
            // Log success or handle response codes (2xx, 4xx, 5xx)
            log.audit('Log Batch Sent', 'Response Code: ' + response.code);
        } catch (e) {
            log.error('Error Sending Logs', e);
        }
    }

    // Call the function, typically within a scheduled script execution context
    // extractAuditLogs();
});
2. SuiteAnalytics Connect
NetSuite offers the SuiteAnalytics Connect service, which provides ODBC, JDBC, and ADO.NET access to your NetSuite data, essentially treating it like a relational database. If the required log data is exposed through Connect schemas (this may vary), you can use standard SQL queries from external tools (ETL platforms, BI tools, custom applications) to pull log data directly. This method requires purchasing the SuiteAnalytics Connect module.
3. NetSuite APIs (SOAP, REST) & Custom RESTlets
You can build custom RESTlets within NetSuite specifically designed to expose log data. External applications can then call these RESTful endpoints periodically to retrieve logs. Alternatively, NetSuite's standard SOAP or REST web services might offer ways to query certain log-related records, though dedicated log access might be limited compared to SuiteScript or Connect.
4. Middleware / ETL Platforms
Many integration platforms (iPaaS) and ETL (Extract, Transform, Load) tools like Celigo, Boomi, MuleSoft, Rivery, or Informatica offer pre-built NetSuite connectors. These connectors often simplify the process of extracting various data types, potentially including logs, and loading them into external databases or data warehouses with minimal custom coding.
5. Native CSV Export
For simpler or less frequent needs, many logs can be viewed as Saved Searches or Reports within NetSuite, which can then be manually or sometimes programmatically exported as CSV files. These files can then be imported into an external database using standard database import tools or scripts. This is generally less suitable for real-time or high-volume automated extraction.
Visualizing the Process
This mindmap illustrates the relationship between NetSuite's logs, extraction methods, and the goal of building a health assessment tool.
(Debug, Audit, Error, Emergency)"] id2["Audit Trail / System Notes"] id3["Activity Logs"] id4["System Logs (Background Jobs)"] id5["Login / Access Logs"] id6["Deleted Record Logs"] id7["Analytics Audit Trail"] Extraction["Log Extraction Methods"] ex1["SuiteScript (Scheduled)"] ex2["SuiteAnalytics Connect (ODBC/JDBC)"] ex3["APIs / Custom RESTlets"] ex4["ETL / Middleware Tools"] ex5["CSV Export"] HealthTool["Health Assessment Tool"] ht1["Purpose
(Performance, Security, Compliance)"] ht2["Analysis Areas
(Scripts, Changes, Logins, Jobs, Data Integrity)"] ht3["Features
(Dashboard, Alerts, Recommendations, Scoring)"] ht4["Implementation
(External DB, BI Tools, Analysis Engine)"]
Building a NetSuite Health Assessment Tool
Once logs are consistently extracted to an external database, you can build a powerful health assessment tool to provide ongoing insights into your NetSuite environment's well-being.
Purpose and Benefits
The primary goal of a NetSuite health assessment tool is to proactively monitor the system's performance, security posture, data integrity, and compliance status. Benefits include:
- Early detection of potential issues (e.g., failing scripts, performance bottlenecks, suspicious user activity).
- Improved system stability and performance through targeted optimization.
- Enhanced security by monitoring access patterns and configuration changes.
- Streamlined compliance and audit readiness with centralized log analysis.
- Data-driven decision-making for system improvements and resource allocation.
Key Components and Data Sources
The tool would ingest and process data primarily from the extracted logs:
- Data Ingestion Layer: Receives log data pushed from NetSuite (via scripts/APIs) or pulls data (via Connect/ETL). Stores data in a structured format (e.g., SQL database, data warehouse).
- Data Transformation Layer: Cleanses, normalizes, and potentially enriches log data (e.g., mapping user IDs to names, correlating related events).
- Analysis Engine: Runs queries and algorithms on the processed log data to identify patterns, anomalies, and trends based on predefined rules and thresholds.
- Presentation Layer: Displays findings through dashboards, reports, and alerts.
Core Analysis Areas
The tool should focus on analyzing logs to assess health across several dimensions:
Performance Monitoring
- Script Health: Analyze Script Execution Logs for high error rates, long execution times, and concurrency limit issues. Identify problematic scripts needing optimization.
- Background Process Health: Monitor System Logs and Activity Logs for scheduled script failures, long-running jobs, and integration errors.
Security and Compliance Monitoring
- User Activity: Analyze Audit Trails and Login Logs for unusual data modifications, deletions (using Deleted Record Logs), unauthorized access attempts, or privilege escalations.
- Configuration Drift: Monitor Audit Trails for changes to critical configurations, roles, permissions, and customizations. Ensure changes align with policies.
Data Integrity
- Change Validation: While logs show changes happened, combine with other checks (potentially outside logs) to ensure data consistency post-change. Monitor for frequent rollbacks or error corrections indicated in logs.
- Deletion Tracking: Use Deleted Record Logs to ensure deletions are authorized and documented.
Customization and Development Practices
- Error Patterns: Analyze Script Execution Logs for recurring error types, indicating potential systemic issues in custom code.
- Log Volume: Monitor the volume of Debug logs in production, which might indicate leftover development code or excessive logging impacting performance.
Health Assessment Visualization
A radar chart can provide a high-level overview of the assessed health across different areas. The scores below are illustrative, representing a snapshot based on log analysis findings compared to target goals and industry benchmarks.
Essential Tool Functionality
Dashboards and Reporting
Provide intuitive visualizations (like the radar chart above, time-series graphs for error rates, tables for critical changes) summarizing key health metrics, trends, and historical data. Allow users to drill down into specific logs or events.
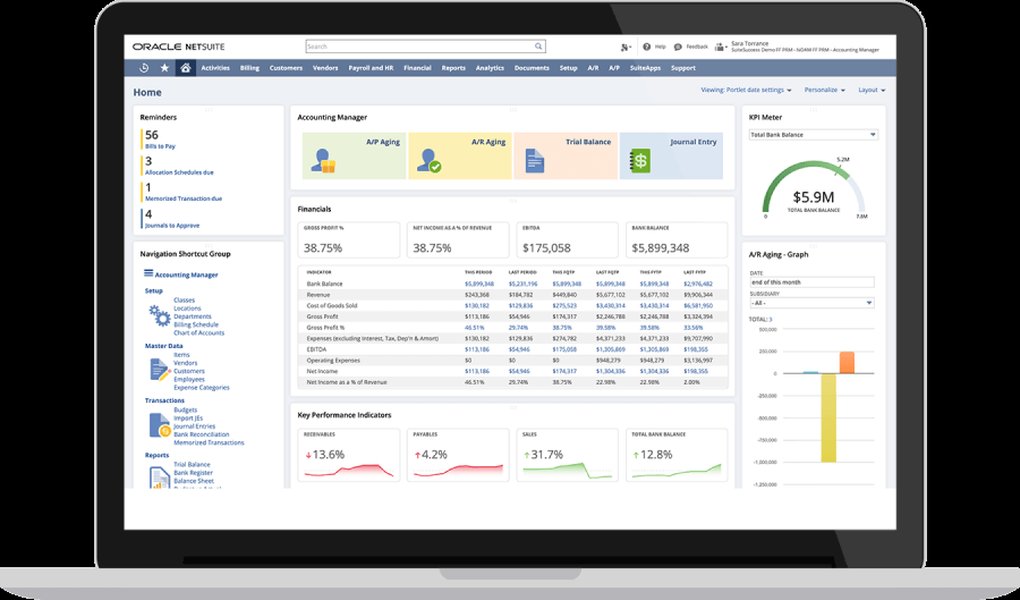
Example of a dashboard visualizing key business metrics, similar principles apply to a health assessment tool.
Alerting and Notifications
Configure rules to trigger real-time alerts (via email, Slack, or other channels) for critical events, such as a spike in script errors, failed critical jobs, emergency log entries, or suspicious login activity.
Recommendations Engine
Based on the analysis, the tool could suggest potential actions, such as identifying specific scripts for optimization, recommending review of certain user permissions, or highlighting configuration areas needing attention.
Health Scoring
Implement a scoring system (as shown in the radar chart) to provide a quantifiable measure of system health over time, allowing for easy tracking of improvements or degradation.
Implementation Considerations
- Technology Stack: The tool is typically built outside NetSuite, using the external database (e.g., PostgreSQL, SQL Server, Snowflake) as the data source. Analysis can be done using SQL, Python scripts, or dedicated log analysis platforms (e.g., ELK stack, Splunk - configured to ingest from your DB). Dashboards can be built using BI tools (Tableau, Power BI) or custom web applications.
- Scalability: Design the data storage and analysis engine to handle potentially large volumes of log data.
- Maintenance: Regularly update analysis rules, thresholds, and ensure the log extraction process remains reliable. Implement data retention policies for the external log database.
Understanding Script Logging in NetSuite
The following video provides insights into using the N/log module in SuiteScript, which is fundamental for generating script execution logs discussed earlier. Understanding how these logs are created helps in interpreting them within your health assessment tool.
Exploration of the SuiteScript N/log module and script execution logs.
Frequently Asked Questions (FAQ)
What are the different log levels in NetSuite SuiteScript?
How long are NetSuite logs typically retained?
Is SuiteAnalytics Connect required to extract logs?
What are the main benefits of building a NetSuite health assessment tool?
Recommended Next Steps
- Explore a detailed comparison of different methods for extracting NetSuite logs, including pros and cons.
- Learn best practices for analyzing NetSuite script performance using execution logs.
- Discover how to set up real-time alerts based on critical changes captured in NetSuite audit trails.
- Investigate strategies for integrating extracted NetSuite logs with popular external monitoring and observability platforms.
References
Last updated May 5, 2025