
Understanding Network Analysis and the Critical Path Method
Delving into Network Concepts and Project Scheduling Techniques
Network analysis and the Critical Path Method (CPM) are fundamental concepts with wide-ranging applications, from understanding complex systems to efficiently managing projects. Network analysis provides a framework for examining relationships and connections within a system, while CPM is a powerful tool specifically designed for project planning and scheduling.
Key Highlights
- Network analysis is a broad field for studying relationships and connections within various systems, including electrical circuits, social structures, and transportation routes.
- Critical Path Method (CPM) is a project management technique focused on identifying the longest sequence of interdependent tasks to determine the minimum project duration.
- Network representation involves visualizing connections through diagrams, matrices, and other models, using terminology like nodes, edges, and paths.
Introduction to Network Analysis
Network analysis is the study of relationships between entities in a network. It involves examining the connections, or links, between entities, as well as the characteristics of the entities themselves. This field provides a powerful lens through which to understand the structure and dynamics of interconnected systems. Networks can be characterized by the type of connections they possess, the number of nodes they contain, and the patterns of connectivity between these nodes. Analyzing these elements helps in understanding how a network functions as a whole.
Applications of network analysis are diverse. In electrical engineering, it's used to find voltages and currents across components in a circuit. In social sciences, it helps identify influential individuals in a social network. In transportation, it can optimize routes and identify bottlenecks. Essentially, any system where entities are interconnected can be analyzed using network analysis techniques.
Diverse Applications of Network Analysis
The principles of network analysis extend across numerous disciplines, offering insights into the structure and behavior of interconnected components or individuals. Here are some key areas where network analysis is applied:
Electrical Circuits
In electrical engineering, network analysis is crucial for determining the electrical parameters within a circuit, such as voltages and currents. Techniques like nodal analysis and mesh analysis are employed to solve for these values in complex circuits. Simplification methods, such as combining components in series or parallel, are also part of electrical network analysis to make calculations more manageable.
Social Networks
Social network analysis focuses on the relationships and interactions between individuals or groups. It helps in identifying key influencers, understanding the spread of information or behaviors, and analyzing group dynamics. Visualizing social networks often involves diagrams where individuals are represented as nodes and their relationships as edges.
Transportation and Logistics
Network analysis is used to optimize routes, manage traffic flow, and identify critical points in transportation networks. Airports, train stations, and roads can be represented as nodes and the connections between them as links. Analyzing these networks helps in improving efficiency and identifying potential issues.
Biological Networks
In biology, network analysis is applied to study complex systems like gene regulation networks, protein interaction networks, and ecological food webs. Understanding the connections within these networks can provide insights into biological processes and system behavior.
Network Representation and Terminology
Representing networks is essential for their analysis. Various methods are used to visually and mathematically depict the structure of a network. Understanding the basic terminology is crucial for interpreting these representations.
Network representations often use diagrams where entities are represented by nodes (also called vertices) and the relationships between them are represented by edges (also called links or arcs). The nature of the relationship can be indicated by the type of edge, such as directed or undirected, and weighted or unweighted.
Another common representation is the adjacency matrix, a square matrix where both rows and columns represent the nodes. The cells in the matrix indicate whether a connection exists between two nodes and, in the case of weighted networks, the strength or cost of that connection.
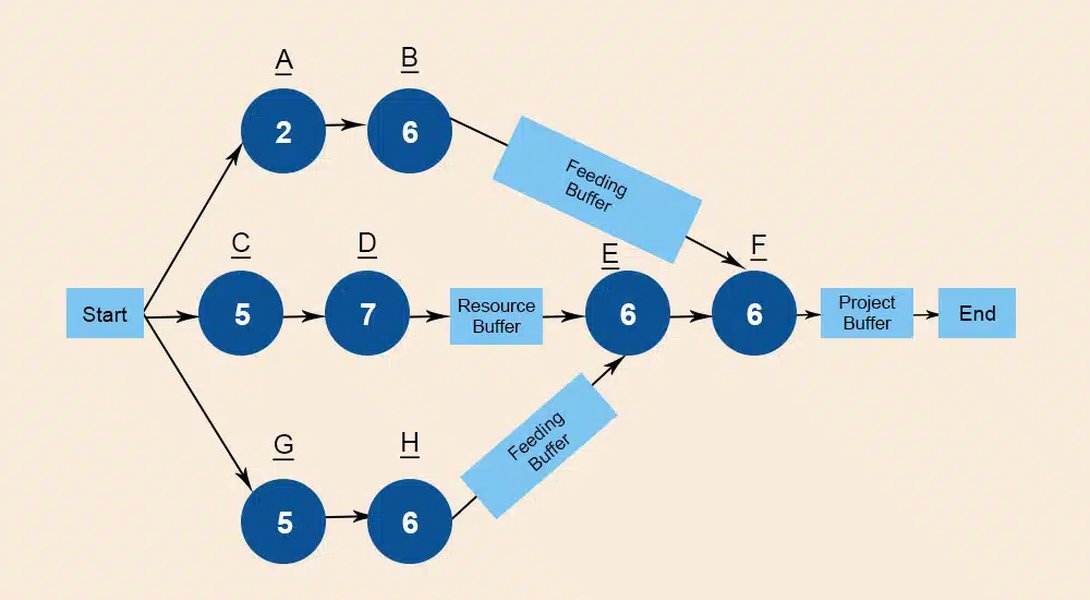
An example of a project network diagram, illustrating tasks and dependencies.
Core Network Terminology
Familiarity with these terms is fundamental to understanding network analysis:
Nodes (Vertices)
These are the individual entities within a network. In a social network, nodes might represent people; in an electrical circuit, they could be components; and in a transportation network, they might be locations.
Edges (Links, Arcs)
Edges represent the connections or relationships between nodes. An edge can be directed, indicating a one-way relationship (like following someone on social media), or undirected, indicating a reciprocal relationship (like being friends). Edges can also be weighted, signifying the strength, cost, or duration of the connection.
Path
A sequence of nodes connected by edges. The length of a path is typically the number of edges it contains, or the sum of the weights of the edges in a weighted network.
Network Topology
The arrangement of the connections within a network. Common topologies include bus, star, ring, mesh, and hybrid. Topology diagrams visually represent how devices are interconnected.
Clustering Coefficient
A measure of the degree to which nodes in a network tend to cluster together. A high clustering coefficient suggests that if node A is connected to node B, and B is connected to node C, there is a high probability that A is also connected to C.
Critical Path Method (CPM) for Project Scheduling
The Critical Path Method (CPM), also known as Critical Path Analysis (CPA), is a widely used project management technique for planning, scheduling, and managing complex projects. It provides a structured approach to identifying the tasks that are critical to completing a project on time and determining the scheduling flexibility of non-critical tasks.
Developed in the late 1950s, CPM has become a cornerstone of project management, offering valuable insights into project timelines, resource allocation, and potential bottlenecks. By breaking down a project into individual tasks, determining their dependencies, and estimating their durations, project managers can identify the longest sequence of activities that dictates the shortest possible project completion time. This sequence is known as the critical path.

Visual representation highlighting the comparison between PERT and CPM.
Steps in Applying the Critical Path Method
Applying CPM typically involves a series of steps to define, sequence, and schedule project activities:
1. Define Project Activities
Identify all the individual tasks or activities required to complete the project. This involves a detailed breakdown of the project scope.
2. Determine Activity Dependencies
Establish the relationships between activities. Which activities must be completed before others can start? These dependencies are crucial for sequencing the project.
3. Construct the Network Diagram
Create a visual representation of the project activities and their dependencies. This is typically done using a network diagram, where nodes represent activities or events, and arrows represent the dependencies between them. Activity-on-node (AON) and activity-on-arrow (AOA) are common methods for drawing these diagrams.
4. Estimate Activity Durations
Estimate the time required to complete each activity. These estimates can be based on historical data, expert judgment, or other estimation techniques. CPM typically uses single-point estimates for durations, unlike PERT which uses three-time estimates.
5. Calculate Early and Late Start/Finish Times
Perform a forward pass through the network diagram to calculate the early start (ES) and early finish (EF) times for each activity. Then, perform a backward pass to calculate the late start (LS) and late finish (LF) times.
\[ \text{EF} = \text{ES} + \text{Duration} \] \[ \text{LS} = \text{LF} - \text{Duration} \]The ES for an activity is the maximum of the EF times of its preceding activities. The LF for an activity is the minimum of the LS times of its succeeding activities.
6. Identify the Critical Path
The critical path is the longest sequence of activities through the network diagram. Activities on the critical path have zero float (also known as slack), meaning any delay in these activities will delay the entire project. Float is calculated as the difference between the late finish and early finish (LF - EF) or late start and early start (LS - ES). Activities with zero float are critical.
7. Monitor and Update the Schedule
As the project progresses, the schedule should be monitored and updated to reflect actual progress and any changes. The critical path may change as the project unfolds.
Benefits of Using CPM
Implementing CPM in project management offers several significant advantages:
-
Improved Scheduling Accuracy: CPM provides a reliable method for creating accurate project schedules by considering task dependencies and durations.
-
Identification of Critical Activities: It clearly identifies the tasks that are most crucial to project completion, allowing managers to prioritize and focus resources effectively.
-
Better Resource Management: By understanding the critical path and the float of non-critical activities, managers can optimize resource allocation and level resources to avoid overloads.
-
Enhanced Risk Detection: CPM highlights the dependencies between tasks, making it easier to identify potential risks and their impact on the project timeline.
-
Clear Communication: The network diagram provides a visual representation of the project schedule, facilitating clear communication among team members and stakeholders.
-
Basis for Performance Monitoring: CPM provides a baseline against which project progress can be tracked and monitored.
CPM vs. PERT
While often used interchangeably, the Critical Path Method (CPM) and the Program Evaluation and Review Technique (PERT) have some key differences. CPM was developed for projects with well-defined activities and predictable durations, while PERT was designed for research and development projects where activity durations are uncertain. PERT uses three-time estimates (optimistic, most likely, and pessimistic) to calculate an expected duration and incorporates probabilities for project completion within a certain timeframe. CPM, on the other hand, typically uses a single estimate for activity duration. However, in modern project management software, the lines between CPM and PERT have blurred, and many tools incorporate elements of both.
FAQ
What is the main purpose of network analysis?
The main purpose of network analysis is to study the relationships and connections between entities within a system to understand its structure, dynamics, and behavior. This can be applied to various fields, including electrical circuits, social structures, and project management.
How is a network represented visually?
Networks are commonly represented visually through diagrams, where nodes represent the entities and edges represent the connections between them. These diagrams can be drawn using methods like activity-on-node (AON) or activity-on-arrow (AOA).
What is the critical path in project management?
The critical path is the longest sequence of dependent activities in a project network diagram. It determines the shortest possible time required to complete the project. Any delay in an activity on the critical path will delay the entire project.
What is float or slack in CPM?
Float, or slack, refers to the amount of time an activity can be delayed without affecting the project's overall completion time. Activities on the critical path have zero float, while non-critical activities have some amount of float.
In which industries is CPM commonly used?
CPM is widely used in various industries with complex projects, including construction, aerospace and defense, software development, manufacturing, and research projects.
References
 d5ln38p3754yc.cloudfront.net
Last updated April 20, 2025