
Network Graph Visualization with Filters
Explore interactive network graphs with customizable node and edge filters
Highlights
- Interactive Visualization: Use Sigma.js and Graphology to render dynamic graphs with a force-directed layout.
- Node & Edge Filtering: Easily filter nodes and edges based on properties such as type, weight, and group.
- Responsive & Customizable: Real-time updates, detailed information panels, and control panels for a seamless user experience.
Introduction
This example demonstrates how to create an HTML page that displays an interactive network graph, enriched with awesome visualizations and robust filtering options. Graph visualizations are essential tools for exploring complex relational data, and with modern JavaScript libraries, you can create dynamic, user-friendly interfaces that allow users to explore graphs by filtering nodes and edges based on specific properties.
The network graph in this example leverages Sigma.js, a versatile JavaScript library that is optimized for rendering and interacting with large network graphs in the browser. Additionally, we use Graphology to manage graph structure and layouts—especially the force-directed layout provided by ForceAtlas2—to place nodes in an intuitive, spatial arrangement based on their relationships.
Implementation Approach
The code is divided into three main sections:
- HTML Structure: Establish a basic HTML framework including a sidebar for filters and a main container for the network graph.
- Graph Initialization and Rendering: Use Sigma.js to render the graph, drawing nodes and edges with customizable attributes such as color, size, and labels.
- Filtering Functionality: Add filter elements (e.g., dropdowns, text inputs, sliders) that allow users to dynamically modify displayed nodes and edges. JavaScript functions listen to user input and update the graph in real time.
HTML Code
Below is the complete HTML code to create an interactive network graph visualization with filtering capabilities. The code includes inline comments for better understanding and customization.
Complete HTML Code Example
<!DOCTYPE html>
<html lang="en">
<head>
  <meta charset="UTF-8">
  <meta name="viewport" content="width=device-width, initial-scale=1.0">
  <title>Interactive Network Graph Visualization</title>
  <!-- Include Sigma.js and Graphology libraries from CDN -->
  <script src="https://cdn.jsdelivr.net/npm/sigma@2.0.0/dist/sigma.min.js"></script>
  <script src="https://cdn.jsdelivr.net/npm/graphology@0.25.1/dist/graphology.umd.min.js"></script>
  <script src="https://cdn.jsdelivr.net/npm/graphology-layout@0.6.1/dist/graphology-layout.min.js"></script>
  <script src="https://cdn.jsdelivr.net/npm/graphology-layout-forceatlas2@0.10.1/dist/graphology-layout-forceatlas2.min.js"></script>

  <style>
    body {
      margin: 0;
      font-family: Arial, sans-serif;
      display: flex;
      height: 100vh;
    }
    /* Sidebar for filters */
    #sidebar {
      width: 320px;
      background-color: #f8f8f8;
      border-right: 1px solid #ddd;
      padding: 20px;
      overflow-y: auto;
    }
    /* Graph container takes remaining space */
    #graph-container {
      flex: 1;
      position: relative;
    }
    /* Styling for filter elements */
    .filter-section {
      margin-bottom: 25px;
    }
    .filter-section h4 {
      margin: 0 0 10px;
      color: #7FA86E;
    }
    label {
      display: block;
      margin: 8px 0 4px;
    }
    select, input[type="number"], input[type="text"] {
      width: 100%;
      padding: 6px;
      margin-bottom: 10px;
      border: 1px solid #ccc;
      border-radius: 4px;
    }
    button {
      background-color: #4CAF50;
      border: none;
      padding: 10px 15px;
      margin: 5px 0;
      color: #fff;
      cursor: pointer;
      border-radius: 4px;
    }
    button:hover {
      background-color: #45a049;
    }
    /* Styling for node information panel */
    .node-info {
      position: absolute;
      bottom: 20px;
      left: 20px;
      background-color: rgba(255,255,255,0.95);
      padding: 15px;
      border-radius: 5px;
      box-shadow: 0 0 10px rgba(0,0,0,0.2);
      max-width: 300px;
      display: none;
    }
  </style>
</head>

<body>
  <div id="sidebar">
    <h2 style="color: #cc9900;">Graph Filters</h2>
    <div class="filter-section">
      <h4>Node Filters</h4>
      <label for="node-type">Node Type:</label>
      <select id="node-type" multiple>
        <!-- Options populated dynamically -->
      </select>
      <label for="min-weight">Minimum Weight:</label>
      <input type="number" id="min-weight" value="0">
      <label for="max-weight">Maximum Weight:</label>
      <input type="number" id="max-weight" value="100">
      <label for="node-group">Node Group:</label>
      <select id="node-group" multiple>
        <!-- Options populated dynamically -->
      </select>
    </div>

    <div class="filter-section">
      <h4>Edge Filters</h4>
      <label for="edge-type">Edge Type:</label>
      <select id="edge-type" multiple>
        <!-- Options populated dynamically -->
      </select>
      <label for="min-edge-weight">Min Edge Weight:</label>
      <input type="number" id="min-edge-weight" value="0">
      <label for="max-edge-weight">Max Edge Weight:</label>
      <input type="number" id="max-edge-weight" value="100">
    </div>

    <div class="filter-section">
      <button id="apply-filters">Apply Filters</button>
      <button id="reset-filters">Reset Filters</button>
    </div>
  </div>

  <div id="graph-container">
    <div class="node-info" id="node-info"></div>
  </div>

  <script>
    // Prepare sample data for our network graph
    const sampleData = {
      nodes: [
        { id: "n1", label: "Node 1", x: 0,  y: 0,   size: 10, color: "#6c3483", type: "user", weight: 75, group: "A" },
        { id: "n2", label: "Node 2", x: 3,  y: 1,   size: 15, color: "#3498db", type: "user", weight: 50, group: "B" },
        { id: "n3", label: "Node 3", x: 1,  y: 3,   size: 8,  color: "#2ecc71", type: "resource", weight: 30, group: "A" },
        { id: "n4", label: "Node 4", x: 5,  y: 3,   size: 12, color: "#e74c3c", type: "server", weight: 85, group: "C" },
        { id: "n5", label: "Node 5", x: 4,  y: 5,   size: 20, color: "#f39c12", type: "user", weight: 65, group: "B" },
        { id: "n6", label: "Node 6", x: 7,  y: 1,   size: 16, color: "#3498db", type: "resource", weight: 40, group: "C" },
        { id: "n7", label: "Node 7", x: 8,  y: 4,   size: 14, color: "#2ecc71", type: "server", weight: 90, group: "A" },
        { id: "n8", label: "Node 8", x: 2,  y: 6,   size: 9,  color: "#e74c3c", type: "resource", weight: 25, group: "D" },
        { id: "n9", label: "Node 9", x: 9,  y: 7,   size: 18, color: "#f39c12", type: "server", weight: 70, group: "D" },
        { id: "n10", label: "Node 10", x: 6, y: 8,   size: 11, color: "#6c3483", type: "user", weight: 55, group: "B" }
      ],
      edges: [
        { id: "e1", source: "n1", target: "n2", label: "Link 1-2", type: "friend", weight: 20 },
        { id: "e2", source: "n1", target: "n3", label: "Link 1-3", type: "access", weight: 45 },
        { id: "e3", source: "n2", target: "n4", label: "Link 2-4", type: "connect", weight: 30 },
        { id: "e4", source: "n3", target: "n5", label: "Link 3-5", type: "friend", weight: 80 },
        { id: "e5", source: "n4", target: "n5", label: "Link 4-5", type: "access", weight: 15 },
        { id: "e6", source: "n5", target: "n6", label: "Link 5-6", type: "connect", weight: 65 },
        { id: "e7", source: "n6", target: "n7", label: "Link 6-7", type: "friend", weight: 50 },
        { id: "e8", source: "n7", target: "n8", label: "Link 7-8", type: "access", weight: 40 },
        { id: "e9", source: "n8", target: "n9", label: "Link 8-9", type: "connect", weight: 75 },
        { id: "e10", source: "n9", target: "n10", label: "Link 9-10", type: "friend", weight: 35 },
        { id: "e11", source: "n1", target: "n10", label: "Link 1-10", type: "access", weight: 60 }
      ]
    };

    // Create a new graph instance using Graphology
    const Graph = graphology.Graph;
    const graph = new Graph();

    // Add nodes to the graph
    sampleData.nodes.forEach(node => {
      graph.addNode(node.id, node);
    });

    // Add edges to the graph
    sampleData.edges.forEach(edge => {
      graph.addEdge(edge.source, edge.target, edge);
    });

    // Assign a force-directed layout to the graph using ForceAtlas2
    graphologyLayoutForceAtlas2.assign(graph, {
      iterations: 100,
      settings: { gravity: 1, scalingRatio: 10 }
    });

    // Initialize the Sigma renderer in the container
    const container = document.getElementById('graph-container');
    const renderer = new sigma.Sigma(graph, container, {
      renderLabels: true,
      renderEdgeLabels: true,
      labelSize: 12,
      nodeReducer: (node, data) => {
        // Return modified node attributes if needed
        return data;
      }
    });

    // Create a copy of the original graph for filter resetting
    const originalGraph = graph.copy();

    // Utility functions to get unique property values from nodes and edges
    function getUniqueValues(property, items) {
      const values = new Set();
      items.forEach(item => {
        if (item[property] !== undefined) {
          values.add(item[property]);
        }
      });
      return Array.from(values);
    }

    // Populate filter options in the sidebar
    function populateFilters() {
      // Populate Node Type Filter
      const nodeTypes = getUniqueValues("type", sampleData.nodes);
      const nodeTypeSelect = document.getElementById("node-type");
      nodeTypeSelect.innerHTML = "";
      nodeTypes.forEach(type => {
        const option = document.createElement("option");
        option.value = type;
        option.textContent = type;
        option.selected = true;
        nodeTypeSelect.appendChild(option);
      });

      // Populate Node Group Filter
      const nodeGroups = getUniqueValues("group", sampleData.nodes);
      const nodeGroupSelect = document.getElementById("node-group");
      nodeGroupSelect.innerHTML = "";
      nodeGroups.forEach(group => {
        const option = document.createElement("option");
        option.value = group;
        option.textContent = group;
        option.selected = true;
        nodeGroupSelect.appendChild(option);
      });

      // Populate Edge Type Filter
      const edgeTypes = getUniqueValues("type", sampleData.edges);
      const edgeTypeSelect = document.getElementById("edge-type");
      edgeTypeSelect.innerHTML = "";
      edgeTypes.forEach(type => {
        const option = document.createElement("option");
        option.value = type;
        option.textContent = type;
        option.selected = true;
        edgeTypeSelect.appendChild(option);
      });
    }

    // Function to filter graph based on user inputs
    function filterGraph() {
      // Get selected values for node type and group filters
      const selectedNodeTypes = Array.from(document.getElementById("node-type").selectedOptions).map(option => option.value);
      const selectedNodeGroups = Array.from(document.getElementById("node-group").selectedOptions).map(option => option.value);
      const minWeight = parseInt(document.getElementById("min-weight").value, 10);
      const maxWeight = parseInt(document.getElementById("max-weight").value, 10);

      // Get selected values for edge filters
      const selectedEdgeTypes = Array.from(document.getElementById("edge-type").selectedOptions).map(option => option.value);
      const minEdgeWeight = parseInt(document.getElementById("min-edge-weight").value, 10);
      const maxEdgeWeight = parseInt(document.getElementById("max-edge-weight").value, 10);

      // Clear current graph
      graph.clear();

      // Filter and re-add nodes based on node filters
      sampleData.nodes.forEach(node => {
        if (selectedNodeTypes.includes(node.type) &&
            selectedNodeGroups.includes(node.group) &&
            node.weight >= minWeight && node.weight <= maxWeight) {
          graph.addNode(node.id, node);
        }
      });

      // Filter and re-add edges only if both source and target exist in filtered nodes
      sampleData.edges.forEach(edge => {
        if (selectedEdgeTypes.includes(edge.type) &&
            edge.weight >= minEdgeWeight && edge.weight <= maxEdgeWeight &&
            graph.hasNode(edge.source) && graph.hasNode(edge.target)) {
          graph.addEdge(edge.source, edge.target, edge);
        }
      });

      // Refresh the renderer to apply updates
      renderer.refresh();
    }

    // Reset filters and graph to original state
    document.getElementById("reset-filters").addEventListener("click", function() {
      // Reset filter input values
      document.getElementById("min-weight").value = 0;
      document.getElementById("max-weight").value = 100;
      document.getElementById("min-edge-weight").value = 0;
      document.getElementById("max-edge-weight").value = 100;
      // Select all options for multiple selects
      document.querySelectorAll("select[multiple]").forEach(select => {
        Array.from(select.options).forEach(option => option.selected = true);
      });
      // Clear graph and reload original nodes/edges
      graph.clear();
      sampleData.nodes.forEach(node => graph.addNode(node.id, node));
      sampleData.edges.forEach(edge => graph.addEdge(edge.source, edge.target, edge));
      renderer.refresh();
    });

    // Event listener for the filter apply button
    document.getElementById("apply-filters").addEventListener("click", filterGraph);

    // Populate filter options on page load
    populateFilters();

    // Interactive node info display on hover
    renderer.on("enterNode", ({node}) => {
      container.style.cursor = "pointer";
      const nodeData = graph.getNodeAttributes(node);
      const nodeInfo = document.getElementById("node-info");
      nodeInfo.innerHTML = `
        <h4>${nodeData.label}</h4>
        <p><b>Type:</b> ${nodeData.type}</p>
        <p><b>Weight:</b> ${nodeData.weight}</p>
        <p><b>Group:</b> ${nodeData.group}</p>
      `;
      nodeInfo.style.display = "block";
    });

    renderer.on("leaveNode", () => {
      container.style.cursor = "default";
      document.getElementById("node-info").style.display = "none";
    });
  </script>
</body>
</html>
Detailed Analysis
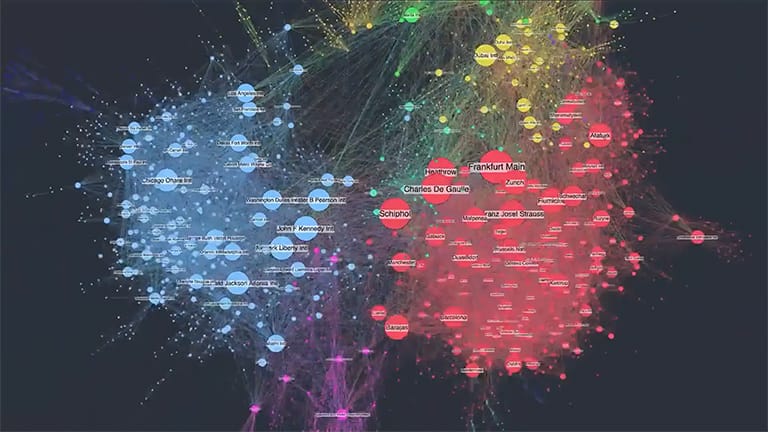
Graph Visualization
The network graph is rendered using Sigma.js, a powerful library that efficiently handles complex network visualizations in the browser. The graph employs a force-directed layout algorithm provided by the ForceAtlas2 engine through Graphology’s layout library. This layout algorithm automatically positions nodes based on their connectivity, ensuring that clusters and relationships are visually intuitive. Each node is represented with customizable attributes, including color, size, and labels. Notably, node colors can be used to indicate specific categories such as type or group while their sizes might represent weighted values.
Interactive Filtering
Filtering is a key component in analyzing large network graphs. In this implementation, filters are provided in the sidebar to allow refinement of nodes and edges dynamically. Two primary filters are implemented for nodes: filtering by type and group, along with a weight range using numerical input fields. Similarly, edge filtering allows the user to narrow down visible connections by type and its corresponding weight range. When filters are applied, the JavaScript code clears the existing graph and repopulates it with only those nodes and edges that satisfy the user-defined criteria. This dynamic rebuild ensures that the visualization instantly updates to provide meaningful insights into the network's structure.
User Experience and Customization
This example is built with responsiveness in mind. The sidebar is fixed in width while the network graph occupies the remaining screen space, allowing for adjustments on various devices. Interactive features such as node hover events help to display detailed information about individual nodes in a floating information panel at the bottom of the graph container. Such real-time feedback greatly enhances the user experience.
Moreover, the code is structured to allow easy modifications. Developers can customize the graph further by changing node shapes, adding additional filters based on more specific properties, or integrating additional visual components such as legends and tooltips. The separation between data initialization and filtering logic ensures that future enhancements can be added without significant changes to the existing structure.
Advantages and Considerations
Implementing an interactive network graph with comprehensive filters offers considerable advantages in data analysis. It enables users to zoom into clusters, identify key hubs, and analyze the interplay between different entities effectively. However, developers should consider performance optimizations when dealing with very large graphs. Techniques such as clustering, lazy loading, and virtualization could be applied to maintain responsiveness.
Conclusion
In conclusion, the above HTML code provides a robust framework for creating interactive network graphs with powerful filtering capabilities. By leveraging Sigma.js and Graphology, developers can seamlessly render graphs that are both visually appealing and easy to explore. The filtering mechanisms allow for in-depth analysis, enabling users to spotlight segments of the network based on node and edge properties. Customization is straightforward, allowing further enhancements and integration of additional libraries if necessary.
Whether visualizing social networks, corporate hierarchies, or any complex relational data, this implementation offers a comprehensive starting point. The balance between interactivity, visual aesthetics, and usability ensures that the visualization serves as a practical tool for both analysis and presentation.
References
-
Sigma.js - sigma.js
- Graphology - Graph Data Structure
-
ForceAtlas2 Layout - Graphology
- Network Graph JavaScript - AnyChart
- Interactive Network Graph Visualization - RapidOps
Recommended
 zoomcharts.wordpress.com
Last updated February 25, 2025