
Unlocking NSE Options: The Multi-Indicator Approach for Strategic Trading
Beyond the single "best" indicator: A holistic view for navigating the dynamic NSE options market.

- 1.Key Insights for NSE Options Trading
- 2.The Foundational Pillars of Options Analysis
- 3.Option-Specific Metrics: The Heart of NSE Options Trading
- 4.Combining Indicators for Powerful Strategies
- 5.Risk Management and Best Practices
- 6.Analyzing the Option Chain: A Deeper Dive
- 7.Visualizing Option Chain Dynamics
- 8.Frequently Asked Questions (FAQ)
- 9.Conclusion
- 10.Recommended Queries
- 11.Referenced Search Results
Key Insights for NSE Options Trading
- No Single "Best" Indicator: Successful NSE option trading relies on a strategic combination of indicators rather than a lone tool, integrating trend, momentum, and volatility/flow analysis.
- Critical Role of Option-Specific Data: Implied Volatility (IV), Open Interest (OI), and Put-Call Ratio (PCR) are indispensable for understanding market sentiment, expected price movements, and liquidity in the options market.
- Timeframe Alignment and Risk Management: Matching indicators and their parameters to your trading timeframe (intraday, weekly, monthly) and implementing robust risk controls are paramount for sustainable options trading.
Navigating the National Stock Exchange (NSE) options market effectively demands a sophisticated approach. While many seek a singular "best" indicator, the consensus among experienced traders is that a combination of complementary indicators provides the most comprehensive and reliable insights. This multifaceted strategy accounts for the unique dynamics of options, encompassing trend identification, momentum analysis, and crucial option-specific metrics like volatility and open interest.
The fast-paced nature of options trading, particularly on indices like Nifty and Bank Nifty, necessitates tools that can quickly adapt to changing market conditions. Therefore, traders often integrate traditional technical analysis indicators with specialized options data to formulate well-informed trading decisions, manage risk, and identify optimal entry and exit points.
The Foundational Pillars of Options Analysis
To truly understand market movements and price behavior in options, traders must consider three fundamental categories of indicators: trend, momentum, and volatility/flow. Each category offers a distinct perspective, and their combined signals provide a robust framework for strategy development.
Trend Identification: Charting the Market's Direction
Understanding the prevailing trend is the first step in any directional trading strategy. Trend indicators help traders discern whether the market is moving upwards, downwards, or sideways, providing a critical context for option selection.
Exponential Moving Averages (EMA)
Exponential Moving Averages (EMAs) are favored for their responsiveness to recent price changes, making them particularly useful for options trading. Shorter EMAs (e.g., 9-period and 21-period) are excellent for identifying short-term trends and generating crossover signals that can assist in timing entries and exits, especially in intraday or short-term Nifty/Bank Nifty trades. Longer EMAs (e.g., 20-period and 50-period) offer a broader perspective on medium-term market direction. A "golden cross" (shorter EMA crossing above a longer EMA) can signal bullish sentiment, while a "death cross" (shorter EMA crossing below a longer EMA) suggests bearishness.
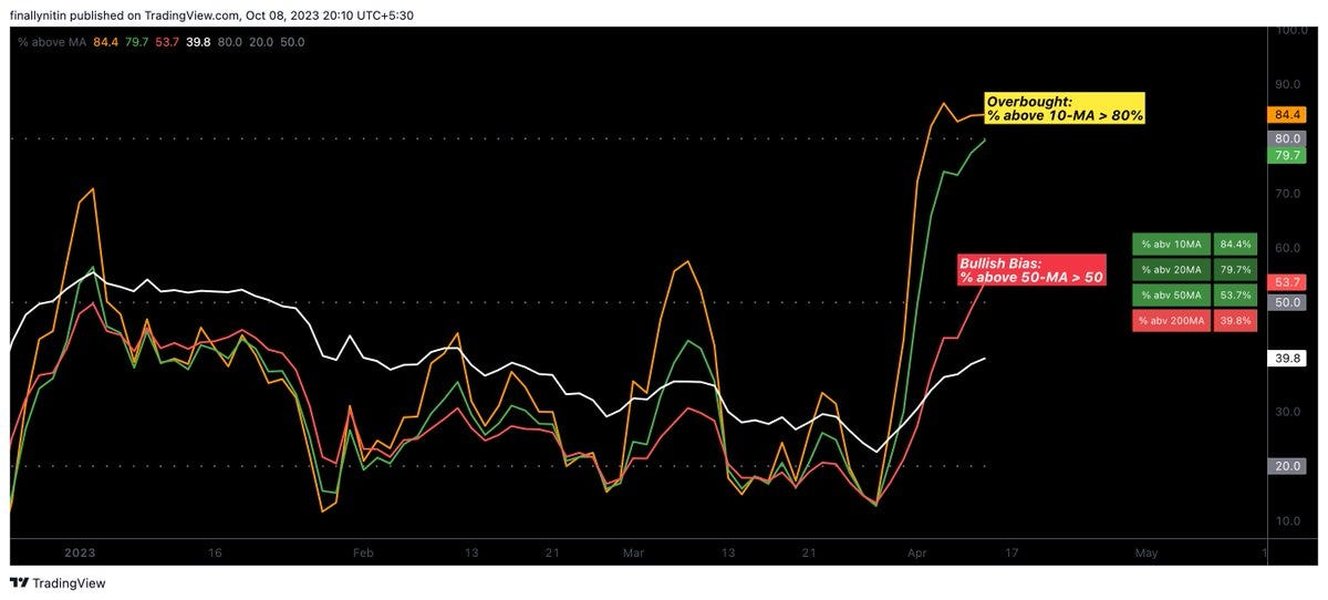
Example of moving averages indicating trend.
Momentum Analysis: Gauging Price Strength and Reversal Potential
Momentum indicators help traders assess the speed and strength of price movements. They are crucial for identifying overbought or oversold conditions, which often precede price reversals, offering timely opportunities for option strategies.
Relative Strength Index (RSI)
The Relative Strength Index (RSI) is a popular momentum oscillator that measures the velocity and magnitude of price changes. Ranging from 0 to 100, RSI typically signals overbought conditions above 70 and oversold conditions below 30. For option traders, these extreme readings can suggest potential reversals, helping in decisions to buy calls during oversold conditions or puts during overbought conditions. While effective for indices, its utility for individual stocks is noted to be even greater due to more frequent overbought/oversold occurrences.
Moving Average Convergence Divergence (MACD)
The MACD is a trend-following momentum indicator that illustrates the relationship between two exponential moving averages. Comprising the MACD line, a signal line, and a histogram, it effectively identifies momentum shifts, potential buy/sell signals, and confirms trend strength. Crossovers of the MACD line and the signal line, along with divergence between the MACD and price, are key signals for traders.
Bollinger Bands
Bollinger Bands are valuable for assessing volatility and identifying potential price reversals. They consist of a simple moving average (typically 20-period) and two standard deviation bands plotted above and below it. Price movements near the upper band can indicate overbought conditions, while those near the lower band suggest oversold conditions. A "squeeze" in the bands indicates low volatility, often preceding a significant price move, which can be advantageous for straddle strategies. Conversely, expanding bands signal increasing volatility and trending moves, suitable for directional option trades.
Option-Specific Metrics: The Heart of NSE Options Trading
Beyond traditional technical analysis, certain indicators are specifically tailored to the unique characteristics of options. These provide critical insights into market sentiment, expected volatility, and liquidity, which are paramount for successful options trading.
Implied Volatility (IV) and IV Rank/Percentile
Implied Volatility (IV) is arguably the most critical indicator for options trading. It measures the market's expectation of future price movements for the underlying asset. High IV typically means option premiums are expensive, favoring option sellers (e.g., iron condors), while low IV suggests cheaper premiums, which might be more attractive for option buyers with strong directional conviction. IV Rank and IV Percentile help traders contextualize current IV against its historical range, preventing them from buying options when IV is at multi-month highs and likely to decline, causing premium erosion.
A mindmap illustrating the various categories of indicators used in NSE option trading.
Open Interest (OI) and Put/Call Ratio (PCR)
Open Interest (OI) represents the total number of outstanding option contracts that have not yet been settled. It's a powerful indicator for identifying liquidity zones, potential support and resistance levels, and where significant market participants (often institutions) are positioning themselves. Rising OI alongside price movements can confirm trend strength. Analyzing changes in OI across different strike prices within the option chain reveals where new positions are being built, providing insights into potential future price action.
The Put-Call Ratio (PCR) is a sentiment indicator derived from the ratio of put options to call options. A PCR greater than 1 often suggests bearish market sentiment (more puts being bought or sold than calls), while a PCR less than 1 can indicate bullish sentiment. Extreme PCR readings can serve as contrarian signals, hinting at potential market reversals.
The NSE Option Chain: A Central Hub of Information
The NSE option chain itself is a comprehensive data source that provides real-time information on all available option contracts for underlying assets like Nifty and Bank Nifty. It displays crucial metrics such as OI, IV, Last Traded Price (LTP), and the Option Greeks (Delta, Gamma, Theta, Vega). Analyzing the option chain allows traders to:
- Identify strikes with high OI and volume to gauge liquidity and market interest.
- Understand the overall sentiment by observing the distribution of OI and volume across call and put options.
- Assess the cost of options through LTP and IV.
- Formulate strategies based on the Greeks, which measure the sensitivity of an option's price to various factors.
Combining Indicators for Powerful Strategies
The true power of these indicators lies in their synergistic application. Combining signals from different categories enhances the accuracy and reliability of trading decisions.
Practical Setups for Different Trading Styles
Intraday (Scalping)
For high-frequency intraday trading on Nifty or Bank Nifty, traders often employ fast EMAs (e.g., 9 and 21 periods) for quick trend identification. VWAP (Volume-Weighted Average Price) can provide a reliable anchor for session bias, while RSI helps pinpoint entry and exit points during momentum shifts. For liquidity and strike selection, a quick glance at IV and OI is sufficient.
Directional Swing Trades
When executing directional swing trades (e.g., buying calls or puts, or implementing long spreads), confirming the trend with longer-period EMAs is crucial. Entry timing can then be refined using momentum indicators like RSI or MACD. It's often advisable to prefer lower IV environments or those with favorable IV skew, utilizing IV Rank to avoid purchasing options when premiums are excessively high.
Option Selling Strategies
For option selling strategies, such as credit spreads or iron condors, prioritizing high IV is key, as it means higher premiums collected. Directional bias can be confirmed using moving averages and RSI. OI analysis becomes vital for selecting appropriate strike prices, identifying points of maximum pain, and ensuring sufficient liquidity.
Risk Management and Best Practices
Regardless of the chosen indicators or strategies, effective risk management is non-negotiable in options trading.
- Timeframe Matching: Always align the chosen indicators and their parameters with your specific trading timeframe (e.g., 5-minute charts for intraday, daily charts for weekly/monthly options).
- Liquidity Assessment: Prioritize strikes with adequate Open Interest and volume to ensure efficient order execution and to accurately interpret market positioning.
- Avoid High IV Buying: Unless possessing a distinct edge, avoid buying options when Implied Volatility is at historically high levels, as premium decay can quickly erode profits. IV Rank/Percentile are valuable tools here.
- Confirmation Bias Mitigation: Never rely on a single indicator. Seek at least two confirming signals (e.g., trend and momentum, or momentum and IV) before initiating a trade.
- Position Sizing: Always size positions based on defined risk parameters, considering factors like theta decay and maximum potential loss.
- Backtesting and Paper Trading: Thoroughly backtest and paper trade any indicator combinations and strategies on historical Nifty/Bank Nifty data before committing real capital.
To provide a clearer perspective on the relative importance and utility of various indicators in the context of NSE options trading, consider the following radar chart:
This radar chart visually represents the perceived importance of various indicators for two distinct options trading approaches: directional buying and selling/spreads, on a scale of 0 to 5. Implied Volatility and Open Interest stand out for options selling, while for directional buying, RSI and EMA crossovers also play a significant role.
Analyzing the Option Chain: A Deeper Dive
The NSE Option Chain is a treasure trove of information that, when interpreted correctly, can offer significant trading advantages. It's not just about knowing what the numbers are; it's about understanding what they imply for market sentiment and future price action.
Key Metrics within the Option Chain
| Metric | Description | Relevance for Options Trading |
|---|---|---|
| Open Interest (OI) | Total number of outstanding contracts not yet closed. | Identifies liquidity, potential support/resistance, and institutional positioning. High OI at a strike indicates a strong price barrier. |
| Change in OI | Daily change in open interest. | Highlights fresh buying or selling activity. Significant increases suggest strong conviction behind a price move. |
| Volume | Total number of contracts traded in a specific period. | Confirms the genuineness of a price move. High volume with rising OI strengthens a signal. Low volume indicates illiquid strikes to avoid. |
| Implied Volatility (IV) | Market's expectation of future price fluctuations. | Crucial for premium pricing. High IV means options are expensive (good for sellers); low IV means options are cheap (good for buyers). |
| Last Traded Price (LTP) | Current price at which an option contract was last traded. | Reflects the real-time value of the option and helps assess profitability or cost. |
| Put-Call Ratio (PCR) | Ratio of put option volume/OI to call option volume/OI. | A sentiment indicator. PCR > 1 suggests bearish sentiment, while PCR < 1 implies bullish sentiment. Extreme values can signal reversals. |
| Option Greeks | Measures of option price sensitivity (Delta, Gamma, Theta, Vega, Rho). | Essential for understanding how an option's price will react to changes in the underlying asset's price, time to expiry, volatility, etc., allowing for advanced risk management and strategy adjustments. |
Summary of critical metrics found in the NSE Option Chain and their relevance.
Here's a visual representation of how different trading styles might prioritize specific types of analysis for NSE options:
This bar chart compares the relative emphasis placed on Technical Analysis (Trend/Momentum), Option Chain Data (OI/IV/PCR), and Risk Management for different NSE options trading styles, on a scale of 0 to 10. It highlights the increased importance of option-specific data for option selling and the consistent high priority of risk management across all styles.
Visualizing Option Chain Dynamics
To further contextualize the discussion on Option Chain analysis, here is a relevant YouTube video that delves into its importance and value for NSE traders.
This video, titled "NSE OPTION CHAIN IV IMPORTANCE/VALUE," discusses the crucial role of Implied Volatility (IV) within the NSE option chain. It likely elaborates on how traders can leverage IV data, alongside other option chain metrics, to make informed decisions. This aligns perfectly with the emphasis placed on IV as a primary indicator for options trading and helps traders understand how to practically interpret this data.
Frequently Asked Questions (FAQ)
What is the single best indicator for NSE option trading?
Why is Implied Volatility (IV) important for option traders?
How does Open Interest (OI) help in options trading?
Can I use RSI and MACD for options trading?
What is the significance of the Put-Call Ratio (PCR)?
Conclusion
In conclusion, the quest for a single "best" indicator for NSE option trading is often misguided. A robust and successful approach integrates a carefully selected combination of trend, momentum, and, critically, option-specific indicators. Implied Volatility (IV), Open Interest (OI), and the Put-Call Ratio (PCR), derived from the NSE option chain, offer unparalleled insights into market sentiment, expected volatility, and liquidity, which are indispensable for making informed options trading decisions. Complementing these with technical indicators like EMAs, RSI, and MACD on the underlying asset creates a powerful analytical framework. Ultimately, consistent profitability in the dynamic NSE options market hinges on a disciplined approach that combines multi-indicator analysis with rigorous risk management, continuous learning, and adaptation to evolving market conditions.
Recommended Queries
- Advanced strategies using option Greeks in NSE trading
- How to backtest option trading strategies on Nifty/Bank Nifty
- Understanding maximum pain theory in NSE options
- Impact of Federal Reserve announcements on NSE options IV