
Nvidia's Near-Term Horizon: What Do Stock Predictions Reveal for the Coming Days and Weeks?
An in-depth look at analyst sentiment, technical signals, and key market drivers shaping NVDA's immediate future.
As of May 14, 2025, Nvidia (NASDAQ: NVDA) stock continues to be a focal point for investors. The technology giant, a leader in artificial intelligence (AI) and graphics processing units (GPUs), has seen remarkable growth. This analysis synthesizes current predictions and market factors to provide a comprehensive outlook for NVDA's stock performance in the upcoming days and weeks.
Key Highlights: Nvidia's Short-Term Outlook
- Bullish Analyst Consensus: A strong majority of analysts maintain a "Strong Buy" rating for Nvidia, underpinned by its robust fundamentals and growth trajectory in the AI sector.
- Technical Strength with Caution: While many technical indicators are positive, including buy signals from moving averages and a recent breakout from a falling trend, the Relative Strength Index (RSI) indicates an overbought condition, suggesting potential for short-term volatility or consolidation.
- Key Price Levels to Watch: Immediate support is identified around the $118-$120 mark, with resistance potentially near $135-$140. Price forecasts for the next few weeks see the stock potentially trading towards the upper end of this range, with some predictions for late May reaching around $137.
Current Market Snapshot and Analyst Sentiment
Strong Buy Signals Dominate Expert Opinions
Nvidia's stock has demonstrated significant upward momentum, with its price increasing over 130% since the beginning of 2024. As of mid-May 2025, the stock is trading actively, with recent prices hovering in the low to mid-$120s. For instance, on May 14, 2025, predictions placed the trading price around $126.37, with daily ranges reflecting typical semiconductor stock volatility.
The overwhelming consensus among financial analysts is bullish. Approximately 44 analysts rate NVDA as a "Strong Buy," with consistent positive ratings for both one-week and one-month outlooks. This optimism is largely fueled by Nvidia's commanding position in the AI chip market, its innovative product pipeline (including the highly anticipated Blackwell GPUs), and strong financial performance. The company reported record revenue of $130.5 billion for fiscal 2025, a year-over-year increase of 114%.
While 12-month price targets average around $164-$169, reflecting a potential 30-40% upside from current levels, the short-term sentiment remains firmly positive, albeit with an awareness of the stock's recent rapid ascent.
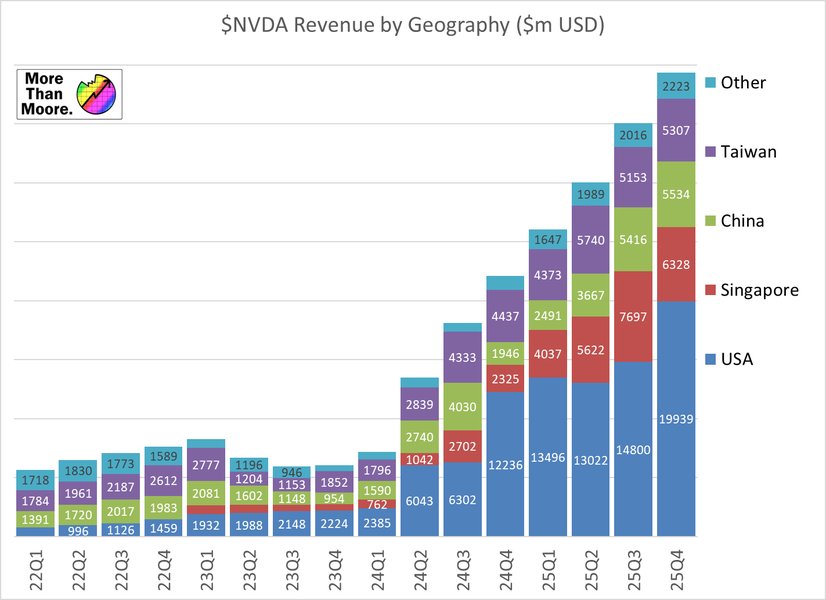
Visual representation of Nvidia's strong financial trends, indicative of its recent growth.
Technical Analysis: Signals and Levels
Navigating Momentum and Potential Volatility
From a technical standpoint, Nvidia's stock presents a compelling, yet nuanced picture for the short term.
Positive Indicators
Several technical signals point towards continued positive momentum:
- Moving Averages: The stock has received buy signals from both short-term and long-term moving averages. The short-term average trending above the long-term average is a classic bullish indicator.
- Trend Breakout: NVDA recently broke through the ceiling of a medium to long-term falling trend channel. This is often interpreted as a sign that a previous downtrend may be ending or reversing, potentially paving the way for a more sustained upward movement.
Key Support and Resistance Levels
Identifying key price levels is crucial for short-term trading strategies:
- Support: Critical support levels are noted around $118-$120. A stronger historical support zone lies near $109.61. Holding above these levels would be constructive for the bullish case.
- Resistance: Immediate resistance is seen around $122.38-$128. If the stock decisively breaks above this, further resistance is anticipated in the $135-$140 zone. Surpassing these levels could open the door for further gains towards the January high of $153.13.
Cautionary Signals: RSI and Volatility
Despite the bullish signals, some indicators warrant caution:
- Relative Strength Index (RSI): The 14-day RSI is currently around 87. An RSI above 70 typically indicates that a stock is "overbought," which can increase the risk of a short-term price correction or a period of consolidation as some investors may look to take profits.
- Volatility: Nvidia's stock has exhibited notable price volatility, around 6.11% over the last 30 days. While this is characteristic of high-growth tech stocks, it means traders should be prepared for potentially significant daily price swings. The Fear & Greed Index, recently at 39 (indicating "Fear"), suggests some underlying market apprehension despite NVDA's specific strengths.
Short-Term Price Projections
Based on current analyses, here's a glance at potential price movements:
- Next Few Days (Mid-May): Prices are forecast to trade within a range, for example, between approximately $117.64 and $128.36, or $120.21 and $132.56, depending on the specific forecast model. Opening prices around May 14th were predicted in the $122-$128 range.
- Next Few Weeks (Towards End of May/Early June): The general outlook is for continued upward bias. Some forecasts suggest the stock could reach around $137.60 by May 28, 2025. Early June prices are expected to hover in the $125–$135 range, potentially pushing towards $140 if bullish momentum persists and key resistance levels are overcome.
Factors Influencing Nvidia's Short-Term Trajectory
Several macroeconomic and company-specific factors are poised to influence NVDA's stock price in the coming days and weeks. This mindmap provides a visual summary of these key drivers and considerations.
(Next Few Days/Weeks)"] Positive_Drivers["Positive Drivers"] AI_Demand["Strong AI & GPU Demand
(e.g., Blackwell Platform)"] Trade_Relations["Improved US-China Trade Relations
(Temporary Tariff Truce)"] Earnings_Anticipation["Anticipation of Strong Q2 Earnings Report
(Expected May 28th)"] Financial_Performance["Solid Recent Financial Performance
(FY2025 Record Revenue)"] Analyst_Sentiment["Overwhelmingly Positive Analyst Sentiment
(Strong Buy Ratings)"] Product_Innovation["Continuous Product Innovation & Leadership"] Potential_Risks["Potential Risks & Considerations"] Overbought_RSI["Technically Overbought RSI (around 87)
- Risk of Short-Term Pullback/Consolidation"] Market_Volatility["General Market Volatility & Sentiment
(Fear & Greed Index showing 'Fear')"] Profit_Taking["Potential for Profit-Taking After Significant Gains"] Valuation_Concerns["Some Views of Potential Overvaluation in Immediate Term"] Geopolitical_Factors["Broader Geopolitical & Economic Factors"] Key_Technicals["Key Technical Indicators"] Moving_Averages["Buy Signals from Short & Long-Term MAs"] Trend_Breakout["Recent Breakout from Falling Trend Channel Ceiling"] Support_Levels["Key Support around $118-$120"] Resistance_Levels["Key Resistance around $128, then $135-$140"] Price_Forecast_Context["Short-Term Price Forecast Context"] Next_Few_Days["Trading Range: approx. $118 - $132"] Next_Few_Weeks["Potential Movement Towards $135 - $140"]
The mindmap above illustrates the interplay of factors affecting Nvidia's stock. Strong demand for its AI technologies, positive developments in international trade, and high expectations for its upcoming earnings report are significant tailwinds. Conversely, the stock's technically overbought status and broader market sentiment introduce elements of caution.
Comparative Strength: Nvidia's Key Attributes
The following radar chart visualizes an opinionated assessment of Nvidia's strengths across several key dimensions relevant to its short-term stock outlook. These are not exact data points but rather a qualitative representation based on the synthesized analysis. The scale is from 1 (lowest) to 10 (highest).
This chart underscores Nvidia's strong position in terms of analyst confidence, its fundamental leadership in AI, and its robust growth and innovation. The slightly lower score for "Short-Term Technical Momentum" reflects the caution due to the overbought RSI, despite overall positive technicals.
Summary of Short-Term Forecasts and Key Levels
To consolidate the various predictions and technical markers, the following table provides a quick reference for investors monitoring Nvidia stock in the near term:
| Aspect | Details / Range | Source Context / Implication |
|---|---|---|
| Predicted Range (May 14, 2025) | ~$117.64 - $132.56 | Consolidated from various daily forecasts, indicating expected intraday volatility. |
| Target by End of May 2025 | Potentially towards ~$137.60 | Upper range of short-term forecasts, contingent on positive catalysts. |
| Key Support Levels | $118 - $120; stronger at $109.61 | Critical price floors to watch; a break below could signal further downside. |
| Key Resistance Levels | ~$128; then $135 - $140 | Price ceilings that need to be breached for continued upward movement. |
| RSI (14-Day) | ~87 (Overbought) | Suggests potential for a short-term pullback or consolidation. |
| Analyst Consensus | Strong Buy | Indicates broad positive sentiment among market experts. |
| Upcoming Catalyst | Q2 Earnings Report (Expected May 28, 2025) | High investor anticipation, could significantly impact price. |
Expert Commentary: Nvidia Stock Analysis Video
For a visual perspective on Nvidia's recent stock movements and key levels to watch, the following video provides analysis relevant to the mid-May 2025 timeframe. It discusses critical price levels and market trends pertinent to understanding NVDA's short-term dynamics.
This video from early May 2025 offers insights into Nvidia's stock price analysis and levels to monitor.
The commentary in such analyses often highlights the interplay between technical chart patterns, market news, and broader sector trends, providing context for the price predictions discussed.
Frequently Asked Questions (FAQ)
What is the general sentiment for Nvidia stock in the next few weeks?
The general sentiment is positive ("Strong Buy" from most analysts). Predictions suggest potential for continued upward movement towards the $135-$140 range by late May or early June, assuming positive market conditions and catalysts like the upcoming earnings report meet expectations. However, caution is advised due to the stock being technically overbought.
What are the main risks for Nvidia stock in the short term?
The primary short-term risks include:
- Overbought RSI (around 87): This increases the likelihood of a price correction or consolidation.
- Market Volatility: Broader market sentiment and economic news can impact NVDA.
- Profit-Taking: After significant gains, some investors might sell to lock in profits.
- Earnings Disappointment: If the upcoming earnings report on May 28th doesn't meet high expectations, it could trigger a sell-off.
What are key price levels to watch for NVDA?
Key levels include:
- Support: Around $118-$120, with a more historical level at $109.61.
- Resistance: Immediate resistance near $128, then a more significant zone at $135-$140.
How is the upcoming earnings report on May 28th affecting Nvidia's stock?
There is significant anticipation for Nvidia's Q2 earnings report on May 28, 2025. Expectations are high for strong revenue and profit growth, driven by AI demand. This anticipation can push prices higher leading up to the report. However, it also creates a risk if the results, or future guidance, don't meet or exceed these lofty expectations, potentially leading to a sharp price reaction.
Recommended Further Exploration
To deepen your understanding of Nvidia's market position and future prospects, consider exploring these related queries:
- What is the projected impact of Nvidia's Blackwell GPU architecture on its future revenue streams?
- What are the primary long-term growth drivers for the AI semiconductor industry and Nvidia's role within it?
- How does Nvidia compare to its key competitors in the AI chip market regarding innovation and market share?
- How do evolving US-China trade policies specifically affect valuations for semiconductor stocks like Nvidia?
References
Last updated May 14, 2025