
Unlock Volatile Markets: Mastering OBV, POC, and ATR for Stock & Options Trading
Navigate high-stakes trading with precision using volume, price control points, and volatility insights.
Trading volatile stocks and their corresponding weekly options presents unique challenges and opportunities. Success often hinges on understanding market dynamics beyond simple price action. This guide explores how integrating On-Balance Volume (OBV), Point of Control (POC), and Average True Range (ATR) can provide a more robust framework for making informed trading decisions in these fast-moving environments.
Key Highlights
- Volume Confirmation is Crucial: OBV helps validate price trends in volatile stocks by showing whether volume supports the move, highlighting potential divergences or confirmations of buying/selling pressure.
- POC Identifies Key Battlegrounds: Point of Control pinpoints price levels with the highest trading volume, acting as critical support/resistance zones where price action often reacts significantly.
- ATR Quantifies Risk & Opportunity: Average True Range measures volatility, providing essential data for setting realistic stop-losses, choosing appropriate weekly option strike prices, and managing position size in unpredictable markets.
Decoding On-Balance Volume (OBV) for Volatile Environments
What is OBV and How Does It Work?
On-Balance Volume (OBV), developed by Joseph Granville, is a momentum indicator that relates price and volume. It operates on the principle that volume precedes price movement. OBV is a cumulative total of volume, adding volume on days the price closes higher and subtracting volume on days the price closes lower.
- If today's close > yesterday's close: Current OBV = Previous OBV + Today's Volume
- If today's close < yesterday's close: Current OBV = Previous OBV - Today's Volume
- If today's close = yesterday's close: Current OBV = Previous OBV
Interpreting OBV Signals
The direction of the OBV line indicates the flow of volume:
- Rising OBV: Suggests accumulation or increasing buying pressure, potentially confirming an uptrend.
- Falling OBV: Suggests distribution or increasing selling pressure, potentially confirming a downtrend.
- Divergence: When price and OBV move in opposite directions (e.g., price makes a new high, but OBV makes a lower high), it can signal a potential trend reversal. This is particularly watched in volatile markets.
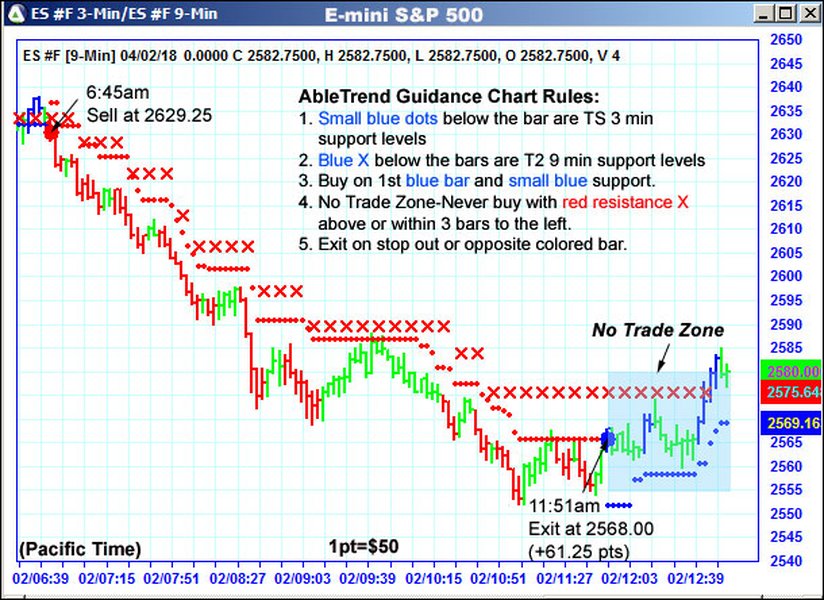 Example of a highly volatile stock chart where indicators like OBV can help discern underlying strength.
OBV in Volatile Stock Trading
While OBV is often considered more effective in sustained trends, it offers valuable insights for volatile stocks:
- Confirming Breakouts: A breakout above resistance accompanied by a rising OBV suggests strong buying interest and increases the probability of a sustained move. Conversely, a breakout with a flat or falling OBV might indicate a false move.
- Spotting Weakness: If a volatile stock is rallying but OBV is declining (bearish divergence), it warns that the move lacks volume support and may soon reverse.
- Filtering Noise: Volatile stocks often have sharp, erratic moves. OBV helps focus on the underlying volume flow, potentially filtering out noise. However, be cautious, as large single-day volume spikes (e.g., due to news) can distort the OBV reading temporarily. Using OBV on higher timeframes (like daily or weekly) or smoothing it with a moving average can mitigate some noise in highly volatile conditions.
Leveraging Point of Control (POC) in Volatile Markets
Understanding POC
Point of Control (POC) is derived from Volume Profile analysis. It represents the single price level where the highest volume of trading occurred over a specific period. This high concentration of trading activity makes the POC a significant reference point, often acting as a strong magnet for price or a critical support/resistance level.
Why POC Matters for Volatile Stocks
- Identifying Fair Value Areas: The POC signifies the price level perceived as 'fair value' by the market during the analyzed period. Price tends to gravitate towards these high-volume nodes.
- Pinpointing Support and Resistance: Because significant trading occurred at the POC, it often represents a strong barrier. A break above or below the POC, especially on high volume (confirmed by OBV), can signal a significant shift in market sentiment.
- Context for Price Action: How price reacts upon approaching the POC (consolidation, rejection, acceptance) provides valuable clues about the market's directional bias, especially useful amidst the sharp swings of volatile stocks.
Utilizing Average True Range (ATR) for Weekly Options
What ATR Measures
Average True Range (ATR) is a technical indicator that measures market volatility. It calculates the average "true range" over a specified period (commonly 14 days). The true range considers the greatest of the following for each period:
- Current High minus Current Low
- Absolute value of Current High minus Previous Close
- Absolute value of Current Low minus Previous Close
ATR doesn't indicate price direction, only the degree of price volatility.
High ATR and Weekly Options Strategy
Weekly options are short-term contracts highly sensitive to volatility. A high ATR is particularly relevant:
- Quantifying Expected Moves: High ATR signifies that the stock typically experiences large price swings. Knowing the ATR value (e.g., an ATR of $3.5 means the stock moves an average of $3.5 per day) helps set realistic expectations for potential price movement within the short lifespan of a weekly option.
- Selecting Strike Prices: For strategies like selling options (e.g., credit spreads, iron condors), a high ATR suggests setting strike prices further out-of-the-money to account for potentially larger moves. For buying options (calls or puts), it helps gauge how far the price might run.
- Risk Management (Stop-Losses): ATR is invaluable for setting stop-losses. In high ATR environments, stops need to be wider to avoid being triggered by normal volatility. A common technique is setting stops at a multiple of ATR (e.g., 1.5x or 2x ATR) below support or above resistance.
- Position Sizing: Higher volatility (high ATR) implies higher risk. Traders often adjust position sizes downward for high ATR stocks to maintain consistent risk exposure across different trades.
 Options trading requires careful consideration of volatility, often visualized on trading platforms.
Synergizing OBV, POC, and ATR: A Unified Strategy
Combining Insights for Enhanced Trading
Integrating OBV, POC, and ATR provides a multi-dimensional view, enhancing decision-making for volatile stocks and weekly options:
- Identify Opportunity & Context: Use ATR to screen for volatile stocks suitable for your strategy. High ATR suggests potential for significant price movement, ideal for certain options strategies. Identify the POC on the relevant timeframe (e.g., daily, weekly) to understand key volume-based support/resistance levels.
- Gauge Momentum & Confirmation: Monitor OBV as price interacts with the POC.
- Bullish Scenario: Price approaches POC from below. If OBV is rising, it confirms buying pressure. A decisive break above POC with increasing OBV strengthens the bullish case. ATR helps estimate the potential upside move for option strike selection.
- Bearish Scenario: Price approaches POC from above. If OBV is falling, it confirms selling pressure. A break below POC with declining OBV strengthens the bearish case. ATR helps estimate the potential downside move.
- Reversal/Fade Scenario: Price reaches POC, but OBV shows divergence (e.g., price higher, OBV lower). This could signal a potential reversal or failure at the POC level, offering opportunities for contrarian trades.
- Manage Risk: Use ATR to set appropriate stop-loss levels based on current volatility, placed logically relative to the POC. Adjust position size according to the ATR reading to manage overall portfolio risk. For weekly options, select strike prices and strategies that align with the expected range derived from ATR and the directional bias suggested by OBV and POC interaction.
Visualizing the Strategy Components
This mindmap illustrates how OBV, POC, and ATR contribute to a cohesive trading strategy for volatile assets and weekly options.
(Stops, Size, Strike Selection)"] id3["Integration Logic"] id3a["ATR: Identify Volatile Candidates"] id3b["POC: Locate Crucial Price Zones"] id3c["OBV: Confirm Volume Support/Momentum"] id3d["ATR: Set Risk Parameters (Stops, Strikes)"]
Comparing Indicator Effectiveness
Relative Strengths in Volatile Trading
This chart provides a subjective comparison of how OBV, POC, and ATR typically perform across different aspects relevant to trading volatile stocks and weekly options. Higher scores indicate greater perceived relevance or effectiveness for that specific function.
Indicator Summary Table
Quick Reference Guide
This table summarizes the primary roles, benefits, and limitations of OBV, POC, and ATR when applied to trading volatile stocks and weekly options.
| Indicator | Primary Role | Key Benefit in Volatile/Options Context | Limitation |
|---|---|---|---|
| OBV (On-Balance Volume) | Measure buying/selling pressure via cumulative volume. | Confirms momentum behind price moves; spots divergences indicating potential reversals. | Can give false signals in extremely choppy markets or due to single large volume spikes; less effective without clear price trends. |
| POC (Point of Control) | Identify price level with highest traded volume. | Highlights significant support/resistance zones; acts as price magnet or pivot point for entries/exits. | Lagging indicator based on historical volume; less predictive in isolation during strong, fast trends. |
| ATR (Average True Range) | Measure market volatility. | Quantifies expected price range for option strike selection; crucial for setting appropriate stop-losses and position sizing in volatile conditions. | Does not predict price direction; value is relative and needs context. |
Visualizing OBV Concepts
Understanding OBV Through Explanation
The following video provides a deeper dive into the On-Balance Volume (OBV) indicator, explaining its calculation, interpretation, and strategic applications in trading. Understanding how OBV reflects volume flow is fundamental when analyzing volatile stocks where price action alone can be misleading.
As demonstrated, OBV helps traders gauge whether 'smart money' is accumulating or distributing shares, providing clues that might precede significant price moves. When combined with POC levels and ATR volatility context, OBV becomes a powerful tool for confirming trade setups in complex market conditions.
Frequently Asked Questions (FAQ)
Can OBV alone be used to trade volatile stocks?
While OBV provides valuable insights into volume flow and potential momentum shifts, relying solely on it for trading volatile stocks is generally not recommended. Volatile stocks can exhibit sharp price swings and high noise levels, which can sometimes generate misleading OBV signals or divergences. OBV works best when confirming price action or used in conjunction with other indicators like POC (for key levels) and ATR (for volatility context) to build a more robust trading thesis and manage risk effectively.
How does POC help specifically with weekly options?
POC helps weekly options traders by identifying high-liquidity price zones that often act as strong support or resistance. For weekly options, which have short timeframes, knowing these critical levels is vital:
- Strike Selection: Traders can choose strikes relative to the POC, anticipating price rejection or acceptance at this level.
- Entry/Exit Timing: Reactions at the POC can signal potential entry or exit points for short-term options trades.
- Risk Management: Placing stops for the underlying stock based on the POC level can help manage risk in the related options position. A break of the POC might invalidate the trade idea.
Should I use a standard ATR period (like 14) for weekly options?
While the standard 14-period ATR is common, traders focusing on weekly options might consider using a shorter period (e.g., 5, 7, or 10 days). A shorter period makes the ATR more sensitive to recent volatility, which is highly relevant for options expiring within a week. This can provide a more current estimate of the expected daily price range, aiding in more precise strike selection and stop-loss placement for short-term trades. However, shorter periods can also be more erratic. It's often beneficial to compare ATR values across different periods (e.g., 7-day vs 14-day) to get a balanced view of recent versus slightly longer-term volatility.
References
- Average True Range (ATR) - Fidelity
- On Balance Volume (OBV) - Investopedia
- Using ATR in Your Trading Strategy - Investopedia
- Use This Simple ATR Strategy To Scalp & Day Trade Options - Market Rebellion
- Using ATR When Trading Options - Option Samurai
- On Balance Volume (OBV) Technical Analysis - Strike.money
- On Balance Volume (OBV) Trading Strategies Explained - TrendSpider
- On Balance Volume (OBV) - StockCharts ChartSchool
Recommended Reading
Last updated April 17, 2025