
Unlock Weekly Options Profits: Harnessing On Balance Volume Signals
Go beyond price action and leverage volume flow to anticipate market moves for short-term options trading.
Trading weekly options demands precision and timely insights. Because these contracts have very short lifespans, identifying potential price movements *before* they fully manifest is crucial. This is where the On Balance Volume (OBV) indicator becomes a valuable ally. Developed by Joe Granville in 1963, OBV is a momentum indicator that uses volume flow to gauge buying and selling pressure, often providing early clues about trend strength and potential reversals.
Key Highlights: OBV for Weekly Options
- Early Momentum Detection: OBV tracks cumulative volume, revealing shifts in buying or selling pressure that may precede significant price changes, vital for short-term weekly option trades.
- Divergence Signals: Identifying divergences between price action and the OBV line can signal potential trend reversals, offering opportunities for timely call or put entries.
- Trend Confirmation: Use OBV to validate the strength of existing trends; rising OBV supports bullish moves (calls), while falling OBV supports bearish moves (puts).
Understanding On Balance Volume (OBV)
The Mechanics of Volume Flow
OBV operates on a simple yet powerful principle: volume precedes price. It maintains a running total of an asset's trading volume, adding volume on days the price closes higher and subtracting volume on days the price closes lower.
Calculation Explained
The calculation is straightforward:- If today's closing price > yesterday's closing price: \( \text{OBV} = \text{Previous OBV} + \text{Today's Volume} \)
- If today's closing price < yesterday's closing price: \( \text{OBV} = \text{Previous OBV} - \text{Today's Volume} \)
- If today's closing price = yesterday's closing price: \( \text{OBV} = \text{Previous OBV} \)
This cumulative line reflects the net flow of volume into or out of the asset. A rising OBV line indicates that volume is heavier on up-days, signaling accumulation or buying pressure. Conversely, a falling OBV line shows heavier volume on down-days, indicating distribution or selling pressure.
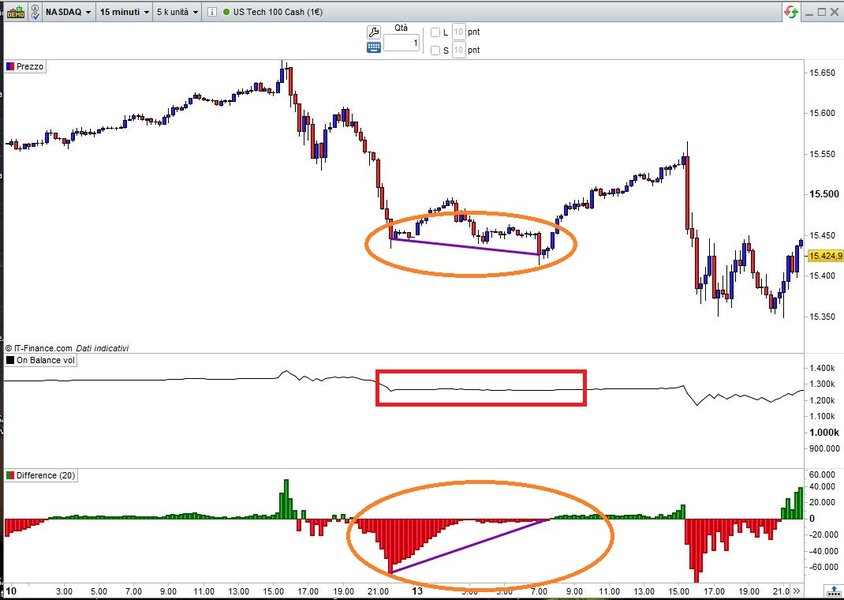 Example chart illustrating the On Balance Volume indicator below the price chart.
Why OBV Matters for Weekly Options
Weekly options are characterized by rapid time decay (theta) and sensitivity to short-term price fluctuations. Success often hinges on correctly anticipating market direction within a limited timeframe. OBV helps by:
- Gauging Underlying Strength: It helps determine if a price move is supported by genuine buying or selling interest (volume) or if it's likely to fizzle out.
- Providing Early Warnings: Divergences between price and OBV can signal potential reversals before they become obvious on the price chart alone.
- Confirming Breakouts: An OBV move in the same direction as a price breakout adds conviction to the trade.
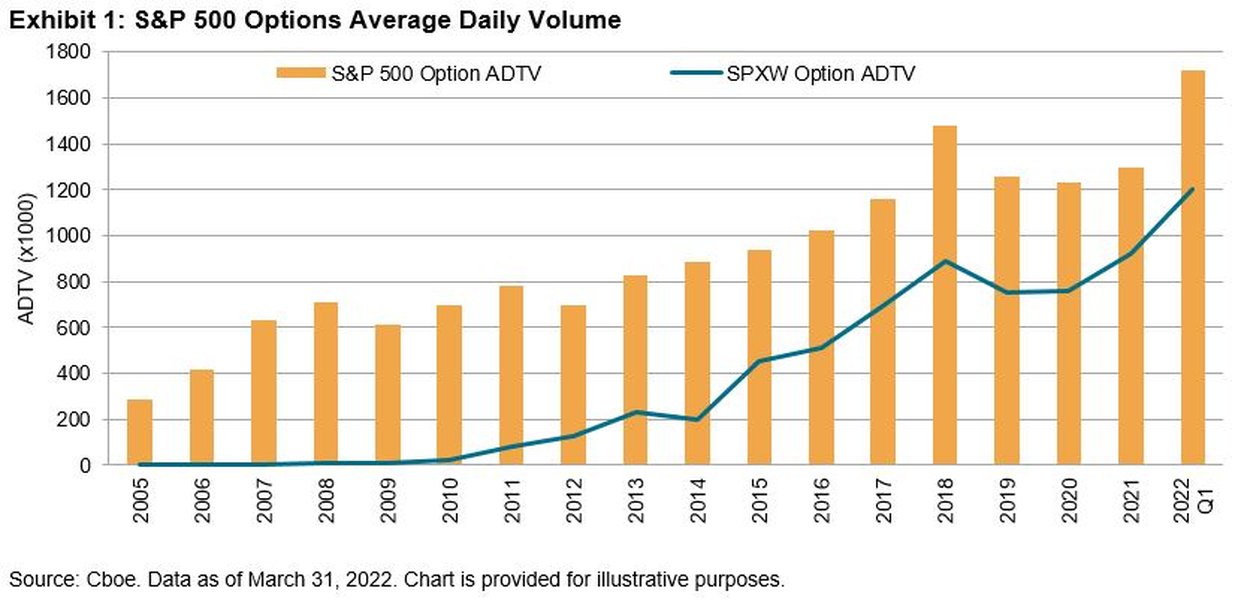 Weekly options require analysis focused on shorter time horizons due to their frequent expirations.
Strategic Application: OBV in Weekly Options Trading
Applying OBV effectively to weekly options requires adapting its signals to the faster pace and higher stakes of short-term trading.
Selecting the Right Timeframes
While analyzing the weekly chart OBV provides context for the broader trend, weekly options traders benefit significantly from examining shorter timeframes to capture signals relevant to the option's lifespan:
- Daily Charts: Offer a balance between capturing significant trends and providing timely signals.
- Intraday Charts (e.g., 60-minute, 30-minute): Crucial for fine-tuning entry and exit points within the week, capturing immediate shifts in volume flow that can impact option premiums quickly.
Monitor OBV on these lower timeframes while keeping the weekly expiration date in mind. Overlaying OBV directly on the price chart can enhance visualization.
Key OBV Signals for Weekly Options
1. Trend Confirmation
The most basic use of OBV is to confirm the prevailing price trend. Strong trends are more likely to continue, benefiting directional option plays.
- Uptrend Confirmation: If the asset's price is making higher highs and higher lows, and the OBV line is also making higher highs and lows, it confirms strong buying pressure. This supports considering weekly call options.
- Downtrend Confirmation: If the price is making lower highs and lower lows, and the OBV line mirrors this pattern, it confirms strong selling pressure. This supports considering weekly put options.
Look for alignment between price action and OBV movement. If price rises but OBV stagnates or falls, the rally might lack conviction.
2. Identifying Divergences
Divergences are powerful signals, often indicating a potential trend reversal. They occur when the price and OBV move in opposite directions.
- Bullish Divergence: The price makes a new low (or lower lows), but the OBV line makes a higher low. This suggests that despite the price decline, selling pressure (volume) is weakening, and accumulation might be occurring stealthily. This is a potential signal to anticipate an upward reversal, favoring weekly call options.
- Bearish Divergence: The price makes a new high (or higher highs), but the OBV line makes a lower high. This implies that buying pressure is waning despite the price increase, suggesting distribution might be underway. This warns of a potential downward reversal, favoring weekly put options.
For weekly options, even short-term divergences on daily or intraday charts can be actionable.
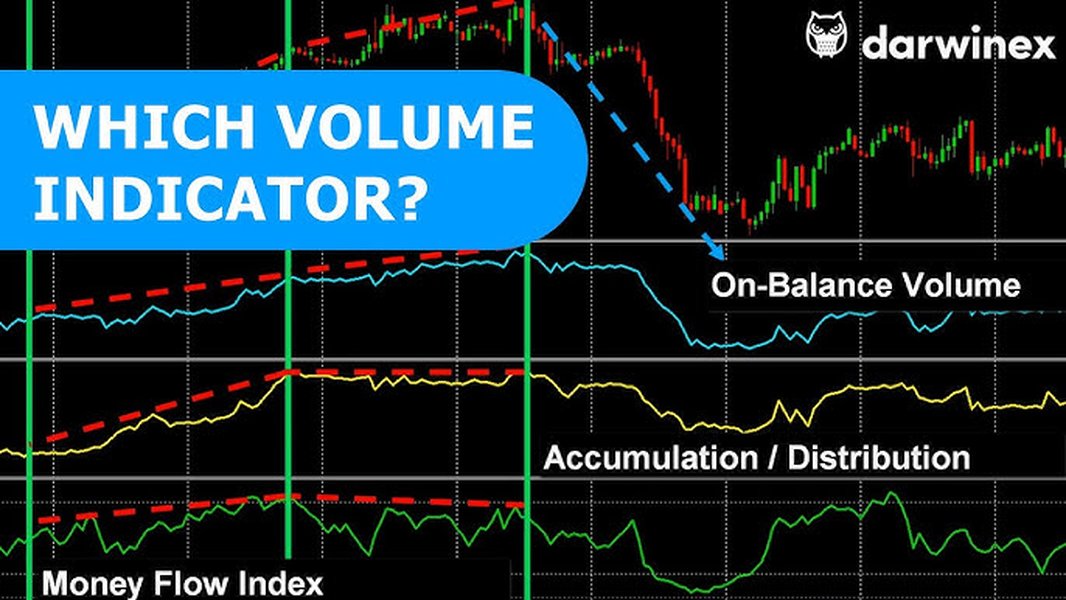 Visualizing OBV alongside price helps identify confirming trends and divergences.
3. Confirming Breakouts
Breakouts from consolidation patterns or key support/resistance levels are common trade setups. OBV can help confirm the validity of a breakout.
- Bullish Breakout: If the price breaks above a resistance level, check if the OBV line also breaks above its corresponding resistance level or shows a strong upward surge. This confirms buying pressure is driving the breakout, increasing confidence in a weekly call option strategy.
- Bearish Breakdown: If the price breaks below a support level, a simultaneous breakdown in the OBV line confirms strong selling pressure, supporting a weekly put option strategy.
An OBV breakout preceding or coinciding with a price breakout adds significant weight to the signal.
4. Volume Analysis during Ranges
OBV can also provide clues during periods of price consolidation (trading ranges).
- Accumulation: If the price is moving sideways, but the OBV line is steadily trending upwards, it suggests accumulation (smart money buying). This often precedes an upward breakout, favoring preparation for call options.
- Distribution: If the price is range-bound, but the OBV line is trending downwards, it indicates distribution (smart money selling). This often precedes a downward breakdown, favoring preparation for put options.
Refining Your Strategy: Combining OBV and Managing Risk
Enhancing Signal Reliability
While OBV is insightful, it's rarely sufficient on its own, especially for high-stakes weekly options trading. Combine OBV signals with other technical indicators for confirmation:
- Momentum Oscillators (RSI, Stochastics): Confirm overbought/oversold conditions or momentum shifts alongside OBV signals. For example, a bullish OBV divergence combined with RSI moving out of oversold territory strengthens a buy signal.
- Trend Indicators (Moving Averages, MACD): Use moving average crossovers or MACD signals to confirm the trend direction suggested by OBV. A price crossing above a key moving average while OBV is rising confirms bullish momentum.
- Price Patterns: Candlestick patterns or chart patterns (e.g., flags, triangles) can provide entry triggers that align with OBV signals.
OBV Signal Strength Comparison (Radar Chart)
This chart offers a conceptual view of how different OBV signals might compare in the context of weekly options trading, considering factors like reliability and speed. Note that this is an interpretive analysis, not based on hard statistical data.
Interpreting the chart: Divergences might offer earlier but potentially less reliable signals on their own, making them highly actionable but requiring confirmation. Trend confirmations are generally more reliable but might occur later. Breakout confirmations are timely but can sometimes be false signals (higher risk indication).
OBV Strategy Mindmap
This mindmap summarizes the core concepts and strategies for using OBV in weekly options trading.
Risk Management is Paramount
Weekly options trading involves substantial risk due to leverage and time decay. Always:
- Use Stop-Losses: Define your exit point before entering a trade based on price levels or a reversal in the OBV signal.
- Manage Position Size: Don't risk a large portion of your capital on a single trade.
- Consider Implied Volatility: High IV can inflate option premiums, increasing risk.
- Be Aware of Market Events: Earnings reports or major news can override technical signals.
Visualizing OBV Strategy in Action
Understanding how indicators like OBV function can be enhanced by seeing them discussed and applied. The following video explores the concept of OBV divergence, a key strategy discussed earlier, highlighting how volume analysis can offer signals that might not be apparent from price alone. Watching experienced traders explain these concepts can provide valuable context, especially regarding identifying potentially strong entry signals based on volume dynamics.
This video discusses OBV as a leading indicator and specifically focuses on using divergence signals, which is highly relevant for anticipating potential reversals – a core technique when using OBV for timing weekly option entries.
OBV Signals and Potential Weekly Option Actions
This table summarizes the primary OBV signals discussed and the corresponding potential actions for weekly options traders. Remember to seek confirmation from other indicators and price action.
| OBV Signal | Price Action | Interpretation | Potential Weekly Option Strategy |
|---|---|---|---|
| Rising Steadily | Rising Steadily | Strong Buying Pressure, Uptrend Confirmed | Consider Buying Call Options |
| Falling Steadily | Falling Steadily | Strong Selling Pressure, Downtrend Confirmed | Consider Buying Put Options |
| Making Higher Lows | Making Lower Lows | Bullish Divergence, Potential Bottom/Reversal Up | Consider Buying Call Options (Anticipating Reversal) |
| Making Lower Highs | Making Higher Highs | Bearish Divergence, Potential Top/Reversal Down | Consider Buying Put Options (Anticipating Reversal) |
| Breaks Above Resistance | Breaks Above Resistance | Bullish Breakout Confirmed | Consider Buying Call Options |
| Breaks Below Support | Breaks Below Support | Bearish Breakdown Confirmed | Consider Buying Put Options |
| Rising | Trading Sideways (Range) | Accumulation during Consolidation | Prepare for Potential Upward Breakout (Calls) |
| Falling | Trading Sideways (Range) | Distribution during Consolidation | Prepare for Potential Downward Breakdown (Puts) |
Frequently Asked Questions (FAQ)
What is the best timeframe to use OBV for weekly options? ▼
While you should be aware of the weekly chart's OBV trend for overall context, focus on daily and intraday charts (like 30-minute or 60-minute) for signals relevant to the short lifespan of weekly options. These shorter timeframes provide more timely indications of volume flow shifts that can impact prices within the week.
Is OBV a leading or lagging indicator? ▼
OBV is generally considered a leading indicator because it attempts to quantify buying and selling pressure based on volume, which often precedes significant price moves. Divergences, in particular, can signal potential trend changes before they are confirmed by price action alone.
Can I use OBV alone for trading weekly options? ▼
No, it's highly recommended *not* to rely solely on OBV. Due to the high risk and speed of weekly options, OBV signals should always be confirmed with other technical indicators (like RSI, MACD, Moving Averages) and price action analysis. Use OBV as part of a comprehensive trading strategy, not in isolation.
Does OBV work in all market conditions? ▼
OBV tends to perform best in trending markets where volume changes clearly indicate strengthening or weakening pressure in the direction of the trend. In choppy, sideways markets, OBV signals can be less reliable or generate false signals. Analysis of accumulation or distribution during ranges can still be useful, but confirmation is crucial.
References
-
On Balance Volume (OBV) - StockCharts School
- OBV Indicator Best Settings & Trading Strategy Guide - Liberated Stock Trader
- How to Use the On-Balance Volume (OBV) Strategy in Trading - Picture Perfect Portfolios
- A Definitive On-Balance Volume Strategy Guide That Works - TradingwithRayner
- On Balance Volume (OBV) Indicator Guide for Traders - PrimeXBT
- Uncover Market Sentiment With On-Balance Volume (OBV) - Investopedia
- On-Balance Volume (OBV) Trading Strategy - Quantified Strategies
Recommended Reading
Last updated April 17, 2025