
Open Source Tools for Enterprise Observability
Exploring powerful, cost-effective, and flexible observability solutions for complex IT environments.
Enterprise observability has become paramount for organizations to understand the behavior of their complex IT systems. With the rise of cloud-native architectures, microservices, and hybrid environments, traditional monitoring approaches often fall short. Observability goes beyond simply knowing if a system is up or down; it provides deep insights into the internal state of a system by collecting, correlating, and analyzing data from various sources like logs, metrics, and traces. This allows for proactive problem identification, faster debugging, and improved system performance and reliability. Open source tools offer a compelling alternative to commercial platforms, providing flexibility, cost-effectiveness, and a vibrant community for support and innovation. This document explores some of the leading open source tools available for building a robust enterprise observability stack in 2025.
Key Insights into Open Source Enterprise Observability
- Prometheus and Grafana form a foundational monitoring and visualization stack: This widely adopted combination is excellent for collecting and visualizing time-series data, making it a cornerstone for many open source observability platforms.
- OpenTelemetry is standardizing instrumentation: This open-source project is rapidly gaining traction as the vendor-neutral standard for generating and collecting telemetry data (logs, metrics, and traces), enabling greater interoperability.
- Diverse tools address specific observability pillars: Beyond metrics and visualization, open source offers specialized tools like Jaeger and Zipkin for distributed tracing and ELK Stack (Elasticsearch, Logstash, Kibana) or Loki for log management.
The Landscape of Open Source Observability
The open source ecosystem provides a rich array of tools that can be combined to create a comprehensive observability platform tailored to specific enterprise needs. These tools often specialize in one or more of the three pillars of observability: metrics, logs, and traces.
Metrics: Understanding System Performance
Metrics are numerical data points collected over time that represent the health and performance of a system or application. Open source tools for metric collection and analysis are fundamental to any observability strategy.
Prometheus: The De Facto Standard for Time-Series Data
Prometheus is a powerful open-source monitoring and alerting system designed for reliability and scalability. It excels at collecting and storing time-series data, making it ideal for monitoring dynamic environments like Kubernetes clusters. Its pull-based architecture and powerful query language (PromQL) provide flexibility in data collection and analysis.
Prometheus integrates seamlessly with various exporters that expose metrics from different systems and applications.
Grafana: Visualizing Your Metrics
Grafana is an open-source platform for monitoring and observability that allows you to query, visualize, alert on, and explore your metrics, logs, and traces. It integrates with a wide range of data sources, including Prometheus, making it the go-to dashboarding tool for many open source observability stacks. Grafana's flexible dashboards and powerful visualization options make it easy to gain insights from your collected data.
The combination of Prometheus for data collection and Grafana for visualization is a popular and effective starting point for building an open source monitoring and observability solution.
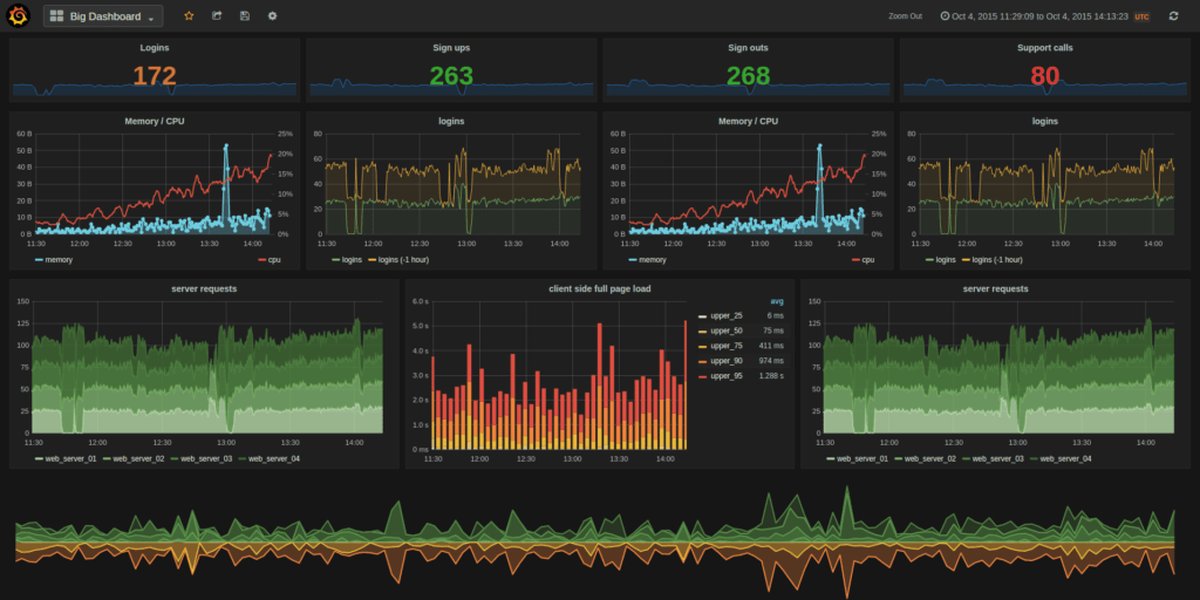
An example of a Grafana dashboard visualizing system metrics.
Logs: Diving into System Events
Logs provide detailed records of events occurring within applications and systems. Analyzing logs is crucial for debugging issues, understanding application behavior, and identifying security threats.
ELK Stack: A Comprehensive Logging Solution
The ELK Stack, comprising Elasticsearch, Logstash, and Kibana, is a widely used open-source solution for collecting, processing, and analyzing log data. Elasticsearch is a distributed search and analytics engine, Logstash is a data processing pipeline, and Kibana is a visualization layer for exploring and visualizing log data.
Loki: Grafana's Log Aggregator
Loki is a horizontally scalable, highly available, multi-tenant log aggregation system inspired by Prometheus. Designed by Grafana Labs, Loki is optimized for cost-effectiveness and ease of operation. It pairs well with Grafana for log exploration and analysis, offering a more metrics-focused approach to logging compared to the ELK Stack.
Traces: Following the Path of Requests
Distributed tracing allows you to track the journey of a request as it propagates through a distributed system. This is invaluable for understanding latency issues, identifying bottlenecks, and debugging complex interactions between microservices.
Jaeger: Distributed Tracing for Microservices
Jaeger, originally built by Uber and now a CNCF project, is a popular open-source distributed tracing system. It helps monitor and troubleshoot transactions in complex distributed systems by visualizing the end-to-end flow of requests.
Zipkin: Another Open Source Tracing Option
Zipkin is another open-source distributed tracing system that helps gather timing data needed to troubleshoot latency problems in microservice architectures. It provides a web UI for viewing trace data.
Standardizing Telemetry with OpenTelemetry
OpenTelemetry is a set of APIs, SDKs, and tools designed to standardize the generation and collection of telemetry data (metrics, logs, and traces). By using OpenTelemetry, organizations can instrument their applications and infrastructure in a vendor-neutral way, avoiding vendor lock-in and enabling greater flexibility in choosing backend analysis tools. Gartner predicts that by 2025, a significant majority of new cloud-native application monitoring will utilize open-source instrumentation like OpenTelemetry.

Illustrating the role of OpenTelemetry in modern observability stacks.
Building a Comprehensive Observability Stack
While individual tools specialize in different areas, the power of open source observability often lies in combining these tools to create a cohesive platform. The "LGTM" stack (Loki, Grafana, Tempo, Mimir) is an example of a popular open source approach built around Grafana's ecosystem for logs, traces, and metrics.
Integrating Different Components
Building an effective open source observability stack involves integrating various components for data collection, processing, storage, analysis, and visualization. OpenTelemetry plays a crucial role in simplifying this integration by providing a unified approach to instrumentation.
Beyond the Core: Other Notable Tools
Several other open source tools contribute to a robust enterprise observability strategy:
- Zabbix: An enterprise-class open-source monitoring solution that offers comprehensive monitoring of networks, servers, and applications with a user-friendly interface.
- Nagios Core: A widely used open-source monitoring system that provides monitoring and alerting for servers, switches, applications, and services.
- Icinga: A fork of Nagios, Icinga is another powerful open-source monitoring system with a focus on scalability and extensibility.
- Netdata: A real-time performance monitoring tool that provides instant visibility into system metrics.
- SigNoz: An open-source observability platform that aims to provide a unified view of metrics, traces, and logs, often seen as an open-source alternative to commercial APM tools.
- OpenNMS: An enterprise-grade open-source platform for network monitoring and management.
Comparing Open Source Observability Tools
Selecting the right open source tools depends on specific requirements, existing infrastructure, and team expertise. The following table provides a high-level comparison of some prominent tools across different observability aspects.
| Tool | Primary Focus | Key Features | Commonly Paired With |
|---|---|---|---|
| Prometheus | Metrics Collection & Alerting | Time-series database, PromQL, Service discovery | Grafana, Alertmanager |
| Grafana | Data Visualization & Dashboarding | Supports multiple data sources, Alerting, Annotation | Prometheus, Loki, Tempo, Elasticsearch |
| Elasticsearch | Log Storage & Analysis | Full-text search, Scalability, Analytics | Logstash, Kibana (ELK Stack) |
| Loki | Log Aggregation | Cost-effective storage, Indexing logs by labels | Grafana |
| Jaeger | Distributed Tracing | End-to-end trace visualization, Root cause analysis | OpenTelemetry |
| Zipkin | Distributed Tracing | Trace collection and lookup, Web UI | OpenTelemetry |
| OpenTelemetry | Instrumentation Standard | APIs, SDKs, Collector for generating and exporting telemetry | Any compliant backend (Prometheus, Jaeger, Loki, etc.) |
| Zabbix | Infrastructure & Application Monitoring | Agent-based and agentless monitoring, Alerting, Reporting | Built-in visualization |
Assessing the Strengths of Key Open Source Tools
To further illustrate the capabilities of these tools, let's consider a radar chart that highlights their relative strengths in different areas relevant to enterprise observability. This chart provides a subjective comparison based on common perceptions and documented features of these tools.
This radar chart visually represents a comparative analysis of the strengths of selected open source observability tools across different dimensions. The scores are illustrative and can vary based on specific implementation and use cases.
Advantages and Considerations of Open Source
Choosing open source tools for enterprise observability offers several benefits, but also comes with certain considerations.
Benefits of Open Source
- Cost-Effectiveness: Open source tools are typically free to use, significantly reducing licensing costs compared to commercial solutions.
- Flexibility and Customization: Access to the source code allows organizations to customize and extend tools to meet their specific requirements.
- Transparency: The open nature of the code base provides transparency into how the tools work, facilitating debugging and trust.
- Community Support: Vibrant communities offer extensive documentation, forums, and contributions, aiding in troubleshooting and innovation.
- Avoidance of Vendor Lock-in: Using open standards like OpenTelemetry with open source tools reduces reliance on a single vendor.
Considerations for Enterprise Adoption
- Deployment and Management Overhead: Setting up and managing open source observability stacks can require significant technical expertise and effort.
- Lack of Commercial Support: While community support is available, dedicated enterprise-level support may require engaging with third-party vendors or building internal expertise.
- Integration Complexity: Integrating multiple open source tools to form a cohesive platform can be complex.
- Feature Gaps: Some advanced features found in commercial platforms might be missing in individual open source tools, although the ecosystem is constantly evolving.
The Role of OpenTelemetry in the Enterprise
The increasing adoption of OpenTelemetry is a significant trend in enterprise observability. Its ability to provide a standardized approach to instrumentation addresses a key challenge in complex environments. By instrumenting applications with OpenTelemetry, enterprises can collect telemetry data in a consistent format, making it easier to ingest and analyze that data with various open source or commercial backend tools.
This interoperability is crucial for enterprises that may have diverse technology stacks and require flexibility in their observability solutions. OpenTelemetry is supported by a wide range of programming languages and frameworks, further enhancing its appeal for enterprise adoption.
Real-World Application and Trends
Many enterprises are successfully building and operating their observability platforms using open source tools. The flexibility and cost advantages make them attractive for organizations of all sizes, from startups to large corporations. The trend towards cloud-native architectures and microservices further drives the adoption of open source tools that are well-suited for these dynamic environments.
Here is a video discussing open source observability with the Grafana stack, providing a practical perspective on building such a platform:
Exploring the Grafana stack for open source observability.
The ongoing development and active communities surrounding these open source projects ensure that they remain at the forefront of observability technology, continuously adding new features and improving performance.
Frequently Asked Questions (FAQ)
Recommended Further Exploration
- How to build a comprehensive open source observability stack?
- What are the benefits of OpenTelemetry for enterprises?
- Deep dive into using Prometheus and Grafana for system monitoring.
- Analyze the trade-offs between open source and commercial observability platforms.
References
Last updated May 20, 2025