
Navigating the Costs of Observability Platforms
Strategies for Optimizing Your Observability Spend Without Sacrificing Insight
Key Takeaways for Observability Cost Optimization
- Data Management is Crucial: Effectively managing the volume, retention, and relevance of telemetry data (logs, metrics, traces) is paramount to controlling costs. Implementing strategies like data reduction, filtering, and sampling before ingestion can significantly impact your observability bill.
- Tool Consolidation Reduces Complexity and Cost: The proliferation of specialized monitoring tools for different aspects of your system (tool sprawl) leads to increased licensing fees, operational overhead, and fragmented data. Consolidating onto a unified observability platform can streamline operations and reduce expenses.
- Adopting Open Source and Open Standards Can Offer Flexibility: While open-source tools may require more management effort, they can provide greater control over your data and infrastructure, potentially leading to lower costs compared to proprietary SaaS solutions, especially at scale. Open standards like OpenTelemetry facilitate data portability and vendor independence.
The Challenge of Spiraling Observability Costs
In the era of complex, distributed systems, microservices, and cloud-native architectures, observability has become indispensable for maintaining system health, ensuring performance, and enabling rapid incident response. However, the benefits of comprehensive visibility often come with a significant and rapidly increasing cost. The volume of telemetry data generated by modern applications can be enormous, and traditional pricing models based on data ingestion or retention can lead to unexpected and substantial bills. Understanding the key drivers behind these costs is the first step towards implementing effective optimization strategies.
Why Observability Costs Can Get Out of Control
Several factors contribute to the potential for observability costs to spiral:
- Data Volume: The sheer amount of logs, metrics, and traces generated by applications and infrastructure is a primary cost driver. As systems scale and complexity increases, so does the data volume.
- Data Retention Policies: Storing large volumes of data for extended periods for compliance, historical analysis, or debugging can incur significant storage costs.
- Tool Sprawl: Using multiple disparate tools for different observability functions (e.g., one for logs, another for metrics, a third for traces) leads to redundant data collection, increased licensing costs, and operational complexity.
- Inefficient Data Ingestion: Sending raw, unfiltered, or redundant data to observability platforms increases processing and storage requirements, directly impacting costs.
- Vendor Lock-in: Proprietary tools and data formats can make it difficult and costly to switch providers or integrate with other systems, limiting negotiation power and flexibility.
- Lack of Cost Visibility: Without clear insight into where observability spend is originating and how it relates to specific services or teams, it's challenging to identify areas for optimization.
Estimates suggest that observability costs can range significantly, with some benchmarks indicating a spend of 10% to 30% of overall cloud infrastructure costs. Managing this spend effectively is crucial for maximizing the return on investment in observability.
Core Strategies for Optimizing Observability Expenses
Optimizing observability costs doesn't mean sacrificing visibility. Instead, it involves implementing smart strategies to manage data, consolidate tools, and leverage appropriate technologies. Here are some core approaches:
Intelligent Data Management
The most impactful way to reduce observability costs is by being strategic about the data you collect, process, and store.
Optimizing Data Ingestion
Not all data is equally valuable. Implementing data pipelines or agents that can filter, sample, aggregate, and transform telemetry data at the source, before it's sent to your observability platform, can drastically reduce ingestion volume and associated costs. This allows you to retain high-fidelity data for critical systems while reducing the volume of less critical or redundant data.
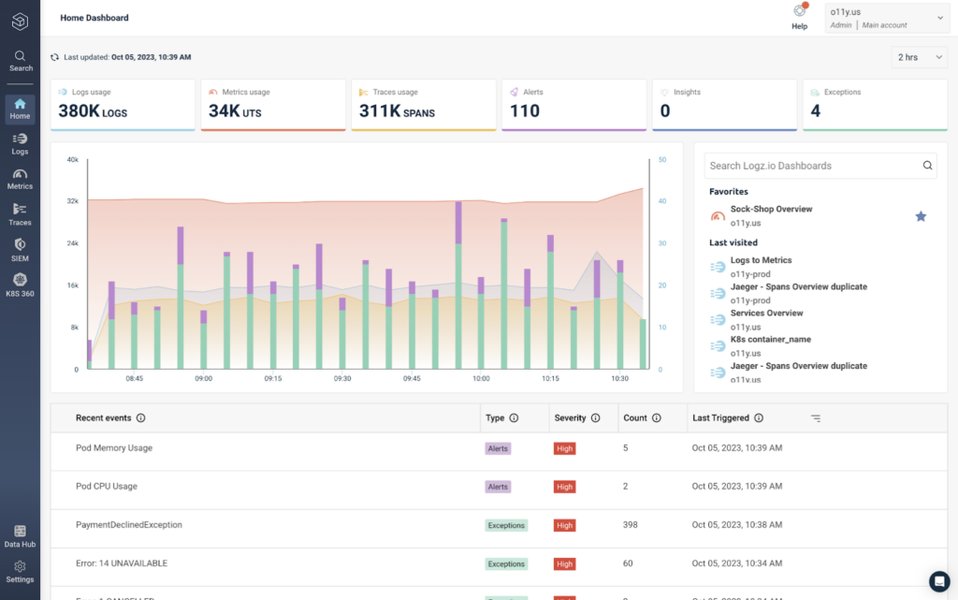
Figure 1: Illustrating the flow of data in an observability pipeline.
Lowering Data Retention Periods
Evaluate your data retention policies based on the actual value and usage of the data. While long-term retention might be necessary for compliance or deep historical analysis, shorter retention periods for less frequently accessed data can significantly reduce storage costs. Consider tiered storage solutions where hot data is readily accessible, and cold data is stored more cost-effectively.
Converting Logs to Metrics
Logs often contain valuable metric information embedded within them. By extracting these metrics at ingestion and sending them as structured metrics rather than raw log lines, you can significantly reduce data volume and improve query performance for trend analysis and alerting.
Tool Consolidation and Simplification
Addressing tool sprawl is essential for reducing licensing fees and operational overhead.
Unified Observability Platforms
Consolidating logs, metrics, and traces onto a single, integrated observability platform provides a holistic view of your system, improves correlation and troubleshooting, and eliminates the need for multiple vendor contracts and management interfaces. This can lead to significant cost savings compared to maintaining separate tools for each data type.
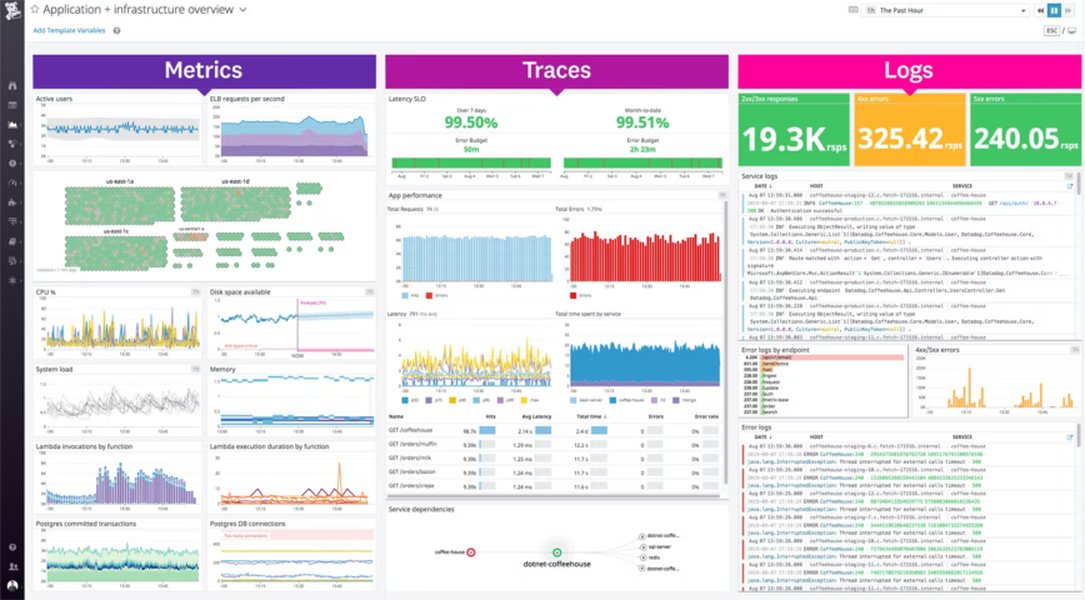
Figure 2: The three pillars of observability – logs, metrics, and traces.
Reducing the "Tool Tax"
The "tool tax" encompasses the costs associated with software licenses, integration efforts between disparate tools, and the overhead of managing multiple vendor relationships. Consolidating tools directly reduces this tax, freeing up resources and budget.
Leveraging Open Source and Open Standards
Open-source solutions and open standards offer alternatives to proprietary platforms that can provide greater control and potential cost savings.
OpenTelemetry Adoption
OpenTelemetry is a collection of tools, APIs, and SDKs used to instrument, generate, collect, and export telemetry data. Adopting OpenTelemetry provides vendor neutrality, preventing lock-in and allowing you to choose the best backend for your needs, potentially including cost-effective open-source options.
Figure 3: An example of a commercial observability platform.
Evaluating Managed Services vs. Self-Hosted
While self-hosting open-source tools can offer cost advantages, it requires significant operational effort for setup, maintenance, and scaling. Managed services for open-source technologies or cost-efficient SaaS platforms can provide a balance between cost control and reduced operational burden.
Advanced Cost Optimization Techniques
Beyond the core strategies, several advanced techniques can further refine your observability cost management.
Cost Visibility and Allocation
Understanding where your observability spend is going is critical for effective optimization.
Implementing Cost Allocation Strategies
Attribute observability costs to specific teams, services, or applications. This provides accountability and encourages teams to optimize their telemetry data generation and usage. This can be facilitated through tagging and reporting features within your observability platform or through dedicated FinOps tools.
Monitoring Cost Trends in Real-Time
Utilize tools that provide real-time visibility into your observability spend. Early detection of cost spikes allows for immediate investigation and corrective action, preventing unexpected overages.
Optimizing Resource Utilization
Observability can also help identify inefficiencies in your underlying infrastructure that contribute to costs.
Identifying Idle Resources
By monitoring resource utilization metrics, you can identify over-provisioned or idle resources (servers, databases, etc.) that can be scaled down or decommissioned, leading to direct infrastructure cost savings, which in turn can offset observability costs.
Key Considerations When Choosing an Observability Solution
When selecting or evaluating an observability platform, several factors related to cost optimization should be considered:
| Consideration | Explanation | Impact on Cost |
|---|---|---|
| Pricing Model | Is the pricing based on data volume, host count, active users, or a combination? Is it transparent and predictable? | Predictable models help avoid overages. Volume-based models require strict data management. |
| Data Management Capabilities | Does the platform offer features for filtering, sampling, aggregation, and data transformation at ingestion? | Robust data management reduces ingestion volume and processing costs. |
| Retention Policies Flexibility | Can you easily configure different retention periods for different data types or sources? | Flexible retention allows for cost-effective storage based on data value. |
| Integration Capabilities | Does it integrate with your existing tools and infrastructure? Does it support open standards like OpenTelemetry? | Good integration reduces the need for custom connectors and minimizes vendor lock-in. |
| Scalability | Can the platform scale efficiently with your data volume and infrastructure growth? | Efficient scaling prevents unexpected cost increases as your system expands. |
| Cost Visibility and Reporting | Does the platform provide tools to track and analyze your observability spend? Can you allocate costs to different teams or services? | Good cost visibility enables informed optimization decisions. |
Understanding Different Pricing Models
Observability platforms employ various pricing models. Some charge primarily based on the volume of data ingested (GB per month), while others might factor in the number of hosts, active users, or a combination. Understanding how a vendor's pricing model aligns with your data generation patterns and usage is crucial for predicting and controlling costs. Look for models that decouple costs from raw data volume where possible or offer flexible tiers and predictable pricing.
Analyzing the Landscape: Open Source vs. Commercial Platforms
The choice between open-source and commercial observability solutions has significant cost implications.
Open Source Solutions (e.g., Prometheus, Grafana, Elasticsearch, Kibana)
Pros:
- Often lower or no direct licensing costs.
- Greater control over data and infrastructure.
- Flexibility and customization options.
- Strong community support.
Cons:
- Requires significant internal expertise for setup, configuration, maintenance, and scaling.
- Can lead to tool sprawl if not managed effectively.
- Total cost of ownership (TCO) can be high due to operational overhead.
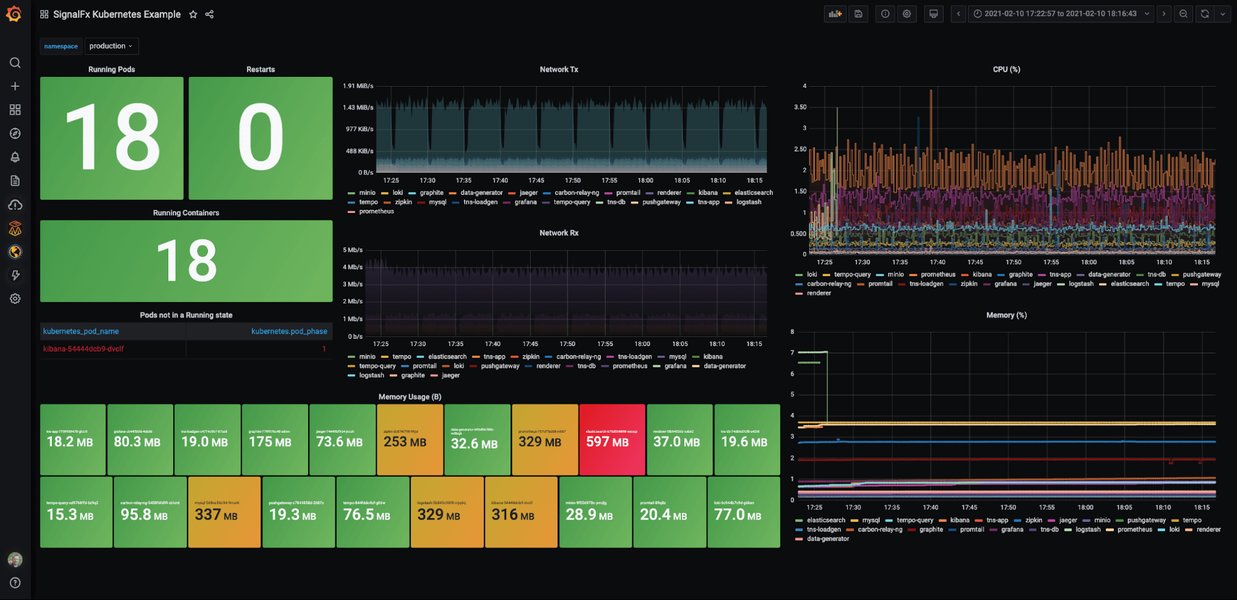
Figure 4: An example of a dashboard from Grafana, a popular open-source visualization tool.
Commercial Platforms (e.g., Datadog, New Relic, Splunk, Dynatrace)
Pros:
- Comprehensive features and integrated workflows.
- Managed services reduce operational burden.
- Professional support and SLAs.
- Faster time to value.
Cons:
- Higher direct licensing costs, often based on data volume.
- Potential for vendor lock-in.
- Less customization flexibility compared to open source.
Many organizations adopt a hybrid approach, leveraging open-source tools for certain functions while utilizing commercial platforms for others, or using managed services for open-source technologies.
Impact of Observability on Mean Time to Resolution (MTTR)
While this discussion focuses on cost optimization, it's important to remember the value proposition of observability. Effective observability significantly reduces Mean Time to Resolution (MTTR) for incidents. By providing deep insights into system behavior, observability tools enable engineering teams to quickly identify the root cause of problems, reducing downtime and its associated costs. Viewing observability as an investment that improves system reliability and developer productivity, rather than just a cost center, is crucial.
Observability as an Investment
When evaluating the cost of observability, consider the return on investment (ROI) in terms of reduced downtime, faster innovation cycles, improved system performance, and increased developer efficiency. A higher upfront investment in a robust observability platform can lead to significant cost savings in the long run by preventing costly outages and reducing the time spent on troubleshooting.
Visualizing Observability Cost Drivers and Optimization Potential
To better understand the various factors influencing observability costs and the potential impact of different optimization strategies, let's visualize them using a radar chart. This chart provides a comparative view of how different areas contribute to overall cost and how effectively various strategies can mitigate them.
This radar chart illustrates that while Data Ingestion Volume and Data Retention Duration are significant cost drivers, there is also high potential for optimization in these areas through effective data management strategies. Similarly, reducing the Number of Tools/Vendors and addressing Operational Overhead offer substantial cost-saving opportunities. Query/Processing Load and underlying Infrastructure Costs also contribute to the overall spend, with varying degrees of optimization potential.
Embracing a FinOps Culture for Observability
Effective observability cost optimization is not solely a technical challenge; it also requires a cultural shift towards financial accountability within engineering teams. Adopting FinOps (Cloud Financial Operations) principles can significantly aid in managing observability spend.
Integrating Financial Accountability into Engineering Workflows
By providing engineers with visibility into the cost implications of their applications and services, they can make more informed decisions regarding instrumentation, data collection, and resource utilization. This fosters a sense of ownership and encourages cost-conscious practices.
Video 1: AWS re:Invent 2023 - Driving down the cost of observability.
This video from AWS re:Invent discusses strategies for reducing observability costs, highlighting the importance of addressing inefficient practices and leveraging appropriate tools and techniques. It provides insights into how organizations can gain better control over their observability spend in cloud environments.
Frequently Asked Questions About Observability Cost Optimization
Recommended Further Exploration
- What are the best practices for developing an enterprise observability strategy?
- How do leading observability tools compare in terms of features and cost?
- What are the steps to implement FinOps principles for better cloud cost management?
- What are the benefits of adopting OpenTelemetry for my observability pipeline?
References
Last updated May 20, 2025