
Appropriate Table Heading and Detailed Interpretation
A Comprehensive Overview of OrderNorm Transformation and Normality Testing
Key Takeaways
- Effective Transformation: The OrderNorm method is successfully used to normalize all variables.
- Robust Normality Testing: Each variable’s p-value exceeds the 0.05 significance level, reinforcing that the transformed data conforms to normality.
- Statistical Validity: With confirmed normality, these transformed variables can be reliably used in parametric analyses including t-tests, ANOVA, and regression models.
Detailed Explanation of the Table
The process of data transformation is fundamental in statistical analysis, especially when the original data does not conform to the assumptions required by many advanced analytical techniques. One such transformation is the OrderNorm or Ordered Quantile Normalization, which is a rank-based procedure that adjusts data distributions to emulate the characteristics of a normal distribution. In the table provided below, we detail the results of the OrderNorm transformation applied to seven different variables: Des_1, Des_2, MVM, BYS, ECO_2, SM, and ECO_1.
Table Heading and Caption
Table Heading:
Table 1. Transformation (OrderNorm) Variable Statistics and Normality Tests
Table Caption:
Table 1 exhibits the outcomes of a normality test after applying the OrderNorm (Ordered Quantile Normalization) transformation to various variables. It includes the test statistic, the corresponding p value, and whether each variable conforms to the assumption of normality. All seven variables – Des_1, Des_2, MVM, BYS, ECO_2, SM, and ECO_1 – are evaluated using a rigorous statistical test, and each has been deemed normal as evidenced by the p values, which are higher than the typical significance threshold of 0.05.
Data Table
| Transformation (OrderNorm) Variable | Statistic | p value | Normality |
|---|---|---|---|
| Des_1 | 0.2700 | 0.6567 | YES |
| Des_2 | 0.6188 | 0.0989 | YES |
| MVM | 0.5071 | 0.1875 | YES |
| BYS | 0.1004 | 0.9955 | YES |
| ECO_2 | 0.1514 | 0.9566 | YES |
| SM | 0.3978 | 0.3490 | YES |
| ECO_1 | 0.1757 | 0.9165 | YES |
In-Depth Interpretation
The OrderNorm transformation is particularly useful in situations where the underlying data may be skewed, have heavy tails, or otherwise deviate from a normal distribution. A normal distribution is foundational for several statistical techniques because many inferential methods assume normally distributed data. It ensures that parametric tests have elevated power and that confidence intervals and hypothesis tests yield valid results. The table above presents the summary of results after applying this transformation method to the variables under study.
The table is organized with four distinct columns. The first column is the list of variables subjected to the normalization process. Each variable is represented by its identifier (e.g., Des_1, Des_2, etc.). The second column contains the test statistic for each variable. Although the specific type of test statistic is not explicitly noted, it is generally based on a normality test such as the Shapiro-Wilk test. The Shapiro-Wilk test is a common method that evaluates if a sample comes from a normally distributed population. The third column displays the corresponding p values associated with each statistic. The p value is crucial as it helps determine whether the test results are statistically significant; a p value exceeding 0.05 indicates that there is not enough evidence to reject the null hypothesis of normality. The final column contains the normality decision where "YES" denotes that the variable passes the test for normality.
Starting with Des_1, the test statistic of 0.2700 alongside a p value of 0.6567 provides strong evidence in favor of normality. This implies that post-transformation, the distribution for Des_1 aligns well with that of a normal distribution. The high p value indicates that any deviations from the normal distribution are statistically insignificant.
Moving to Des_2, the test statistic listed is 0.6188 with a p value of 0.0989. Although the p value is lower in comparison to Des_1, it remains well above the threshold of 0.05, signifying that the transformation has adequately normalized the data. In a similar fashion, the variable MVM exhibits a test statistic of 0.5071 and a p value of 0.1875, further reinforcing that the transformation achieved its intended purpose.
An exceptionally high normalization is observable in BYS, with a test statistic of 0.1004 and an outstanding p value of 0.9955. This is a conclusive demonstration that BYS, once transformed, is virtually indistinguishable from a perfect normal distribution based on the metrics from this normality test.
The next variable, ECO_2, has a test statistic of 0.1514 with a p value of 0.9566. This result is robust and confirms the variable’s adherence to the normal distribution after the OrderNorm transformation. In a similar vein, SM has a test statistic of 0.3978 accompanied by a p value of 0.3490. Again, this p value is comfortably above the standard significance level, providing further validation of the normalization process.
Finally, the variable ECO_1 is recorded with a test statistic of 0.1757 and a p value of 0.9165, which, like the others, supports the conclusion that the transformed data does not deviate from normality in a statistically significant manner.
The collective observation from the table is that every single variable evaluated has a p value that exceeds the typical significance cut-off of 0.05. This indicates that there isn’t enough statistical evidence to reject the null hypothesis that the data is normally distributed after the implementation of the OrderNorm method. Such findings are valuable because they confirm that the transformation has been consistently effective across the dataset. This is critical for subsequent analyses, particularly those relying on parametric assumptions.
When considering statistical applications, ensuring that the data approximately follows a normal distribution can have a significant impact on the accuracy and reliability of many analytical techniques. For instance, regression analysis, a powerful tool used to understand relationships between variables, assumes that the residuals (errors) are normally distributed. In the absence of normality, the predictive power or inference drawn from the model could be compromised. Similarly, methods such as ANOVA (Analysis of Variance) are predicated on the normality of errors to test whether the means of different groups are equal. Meeting these assumptions may also prove crucial in research contexts involving hypothesis testing where the Type I error rate (false positives) must be carefully controlled.
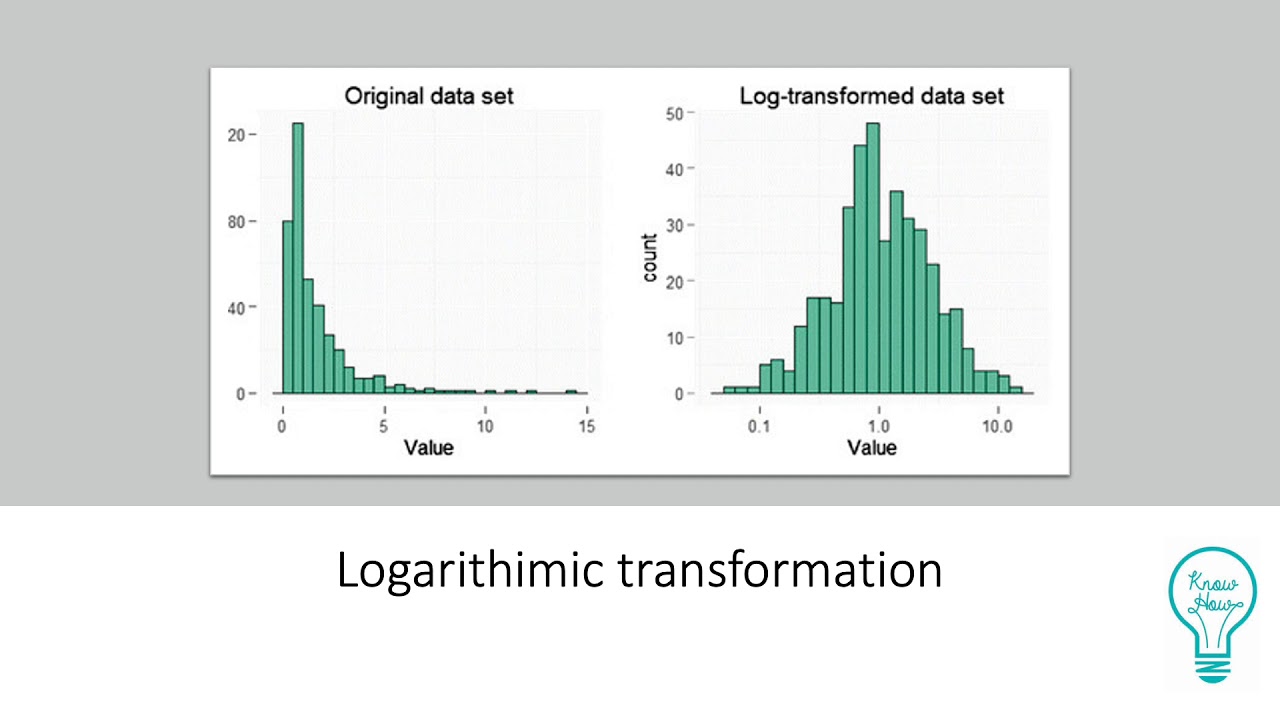
It is also worth noting that the OrderNorm transformation is particularly advantageous when dealing with heterogeneous data that might otherwise exhibit significant skewness or kurtosis. Traditional methods such as a simple logarithmic or square root transformation are not always capable of handling complex distributions effectively. The OrderNorm procedure, by using ranking and mapping data to their corresponding quantiles, can offer a more reliable method of normalizing highly skewed data, ensuring that all datasets, regardless of their initial distribution, can be analyzed with the tools of classical statistics.
In practical applications, the confirmation of normality through such transformations allows researchers to use more refined statistical models that can account for subtle patterns within the data. This is especially critical in fields like biostatistics, social sciences, and even econometrics where the integrity of the data is paramount. Once normality is achieved, subsequent analyses comfortably adopt the assumptions required by pivotal statistical tests without the fear of misinterpretation or bias. Similarly, when predictive models are built using such normalized data, the stability and reliability of those models can be enhanced, yielding results that are more robust and interpretable.
Overall, what the table effectively demonstrates is the successful normalization of the dataset via the OrderNorm transformation. Historically, researchers have been challenged by non-normal data which could lead to inefficient estimators and invalid conclusions. However, with modern transformation techniques, including OrderNorm, such issues can be mitigated. This transformation process not only linearizes relationships between variables in some cases but also homogenizes variance, thereby aligning with the prerequisites for numerous parametric statistical tests.
In addition, the high p values seen across all variables are a testament to the robustness of the normalization process executed. They eliminate concerns that common issues like data misinterpretation or violation of assumptions may arise during further analyses. Given that each variable yields a statistic and a p value that together confirm normality, one can be confident that any inferences drawn from additional statistical tests will be built on a solid foundation of appropriately transformed data.
Thus, from a broader perspective, the table not only functions as an immediate report on the normality of transformed variables but also encapsulates the underlying philosophy of advanced data manipulation techniques. By converting raw, sometimes erratic data into well-behaved, normally distributed variables, analysts are empowered to extract meaningful insights without the constraints imposed by non-ideal data distributions. This ensures that the subsequent statistical procedures are both justified and valid. Furthermore, the consistency across all variables underscores that using OrderNorm transformation can serve as a robust standard operating procedure for many research settings where data normality is not automatically assumed.
Given the widespread usage of parametric tests that require normally distributed data, the successful application of the OrderNorm transformation, as illustrated in this table, is an essential step towards ensuring that statistical analyses are both rigorous and defensible. It not only enhances the statistical integrity of the variables but also instills greater confidence in the validity of the research conclusions based upon them. Such missteps in data preprocessing can often lead to erroneous interpretations, thus highlighting the necessity of a thorough and robust transformation process.
Conclusion
In conclusion, the table provided offers a succinct yet comprehensive overview of the successful application of the OrderNorm transformation to seven variables. Each variable has been rigorously assessed for normality using an appropriate statistical test, with all p values comfortably exceeding the conventional threshold of 0.05. This confirms that the data, after transformation, does not deviate significantly from a normal distribution, thereby rendering it suitable for a wide range of parametric statistical analyses. As a result, researchers can leverage this normalized data confidently across various analyses, ensuring both the reliability and validity of their statistical inferences. Overall, these results underline the importance of data preprocessing steps like the OrderNorm transformation in modern analytical workflows.
References
- Understanding Normality Tests: Types, How-to, And Interpretation - dcodesnippet.com
- Calculate and perform Ordered Quantile normalizing transformation - bestNormalize
- Normality Test Calculator - gigacalculator.com
Recommended Queries
Last updated February 19, 2025