
Introduction to Analysis of Variance (ANOVA)
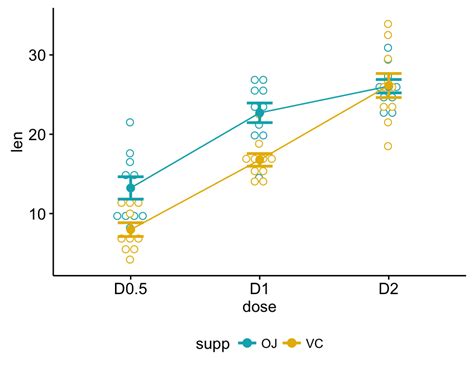
What is ANOVA?
Analysis of Variance (ANOVA) is a robust statistical method used to determine whether there are significant differences between the means of three or more independent groups. Unlike the t-test, which compares the means of two groups, ANOVA extends this comparison to multiple groups simultaneously. By partitioning the total variability in a dataset into components attributable to different sources, ANOVA assesses the impact of one or more categorical independent variables on a continuous dependent variable.
Underlying Principles
F-Statistic
At the heart of ANOVA lies the F-statistic, which is the ratio of the variance between groups (explained variance) to the variance within groups (unexplained variance). Mathematically, it is represented as:
$$ F = \frac{\text{Variance Between Groups}}{\text{Variance Within Groups}} $$
A larger F-statistic indicates that the group means are more spread out than would be expected by random chance, suggesting a statistically significant difference between group means.
Assumptions
- Independence of Observations: The data collected from different groups should be independent of one another.
- Normality: The distributions of the dependent variable within each group should be approximately normally distributed.
- Homogeneity of Variances: The variances within each of the groups should be roughly equal.
Violations of these assumptions can affect the validity of ANOVA results. Diagnostic tests such as the Shapiro-Wilk test for normality and Levene's test for homogeneity of variances are commonly used to assess these assumptions. If assumptions are violated, data transformations or alternative non-parametric tests like the Kruskal-Wallis test may be considered.
Types of ANOVA
One-Way ANOVA
One-Way ANOVA examines the impact of a single independent variable on a dependent variable by comparing the means of three or more groups. For instance, it can be used to compare the average test scores of students taught using different teaching methods.
Two-Way ANOVA
Two-Way ANOVA extends the analysis to two independent variables, allowing for the examination of both the individual effects of each variable and the interaction effect between them. For example, it can assess the impact of different fertilizers and watering techniques on crop yield, as well as how these two factors interact to influence the outcome.
Repeated Measures ANOVA
Repeated Measures ANOVA is used when the same subjects are measured multiple times under different conditions or over different time points. This approach accounts for the correlation between repeated measurements on the same subject, making it suitable for longitudinal studies like measuring blood pressure before, during, and after a treatment.
Assumptions of ANOVA
Independence of Observations
The fundamental assumption of ANOVA is that the observations within each group are independent of each other. This means that the data collected from one group should not influence or be related to the data collected from another group.
Normality
ANOVA assumes that the data within each group are normally distributed. While ANOVA is relatively robust to violations of normality with large sample sizes, significant deviations can affect the test's validity. When normality is violated, researchers may apply data transformations or opt for non-parametric alternatives.
Homogeneity of Variances
Another key assumption is that the variances within each of the groups are approximately equal. This condition, known as homoscedasticity, ensures that the comparison of group means is fair. The Levene's test is commonly used to assess this assumption. If variances are unequal, adjustments or alternative methods may be necessary.
Hypotheses in ANOVA
Null Hypothesis (H₀)
The null hypothesis in ANOVA states that all group means are equal. Formally:
$$ H_0: \mu_1 = \mu_2 = \mu_3 = \dots = \mu_n $$
Alternative Hypothesis (H₁)
The alternative hypothesis posits that at least one group mean is different from the others.
Rejecting the null hypothesis suggests that there are significant differences between group means, warranting further investigation to identify which specific groups differ.
Mathematical Foundations
ANOVA decomposes the total variability in the data into two main components:
- Between-Group Variance: Represents the variability due to the interaction between the groups. It measures how much the group means differ from the overall mean.
- Within-Group Variance: Represents the variability within each group, measuring how much individual observations deviate from their respective group means.
The F-statistic is calculated as the ratio of the between-group variance to the within-group variance:
$$ F = \frac{\text{Mean Square Between}}{\text{Mean Square Within}} $$
Where:
- Mean Square Between (MSB): Variance between groups, calculated by dividing the between-group sum of squares by its degrees of freedom.
- Mean Square Within (MSW): Variance within groups, calculated by dividing the within-group sum of squares by its degrees of freedom.
If the calculated F-statistic exceeds the critical value from the F-distribution table for the given degrees of freedom, the null hypothesis is rejected, indicating significant differences between group means.
Post-hoc Tests
While ANOVA can indicate that there are significant differences between groups, it does not specify where these differences lie. Post-hoc tests are conducted after ANOVA to determine which specific groups differ from each other. Common post-hoc tests include:
-
Duncan's Multiple Range Test: A stepwise procedure that controls the type I error rate while comparing all possible pairs of means.
-
Dunnett's Test: Specifically used when comparing multiple treatment groups against a single control group.
-
Scheffé's Test: A versatile method that can be used for any number of comparisons, providing protection against type I errors.
Applications of ANOVA
ANOVA is widely employed across various fields due to its ability to handle multiple group comparisons efficiently. Some prominent applications include:
Medicine
In clinical trials, ANOVA is used to compare the effectiveness of different treatments or drugs across multiple patient groups. For example, assessing the efficacy of three different medications in reducing blood pressure.
Agriculture
ANOVA helps in comparing crop yields under various fertilizer types or farming techniques. By analyzing multiple groups, researchers can determine the most effective methods for increasing productivity.
Engineering
Engineers use ANOVA to compare the performance of different materials or manufacturing processes. For instance, evaluating the strength of materials produced using different production methods.
Psychology
Psychologists apply ANOVA to study the effects of various therapies or interventions on behavioral outcomes. For example, comparing the effectiveness of multiple counseling approaches in reducing anxiety levels.
Business
Businesses utilize ANOVA to analyze customer satisfaction across different products or evaluate the impact of various marketing strategies on sales performance.
Conclusion
Analysis of Variance (ANOVA) is a fundamental statistical tool that facilitates the comparison of means across multiple groups. Its ability to handle complex experimental designs with multiple factors makes it indispensable in diverse fields such as medicine, agriculture, engineering, psychology, and business. Proper application of ANOVA involves understanding its underlying principles, carefully checking its assumptions, and, when necessary, conducting post-hoc tests to uncover specific group differences. Mastery of ANOVA enhances the robustness and reliability of research findings, enabling informed decision-making based on empirical data.
Further Resources
For a more comprehensive understanding of ANOVA and its applications, consider exploring the following resources:
These resources provide extensive information on the theory, application, and practical implementation of ANOVA, enhancing your ability to effectively utilize this statistical method in various research and analytical contexts.
Last updated January 5, 2025