
Understanding Process Flow Diagrams in Industrial Plant Engineering
Explore the purpose, components, and significance of PFDs with detailed examples and illustrations
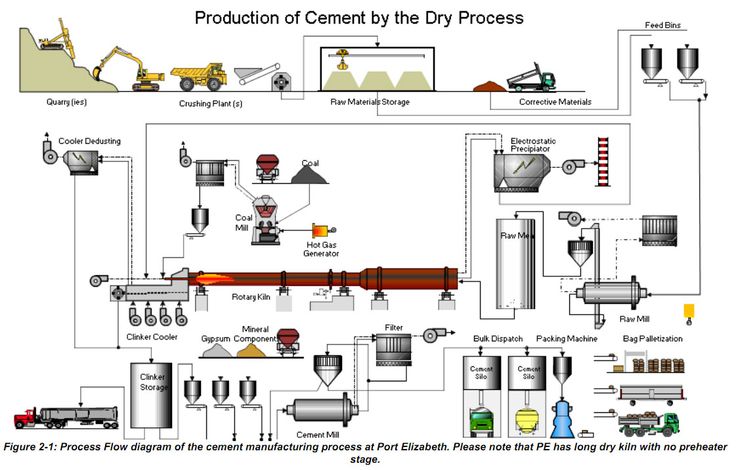
Key Highlights
- Purpose: PFDs offer a clear visual representation of process flows, facilitating design definition and optimization.
- Components: They delineate major equipment, flow directions, and operational data to simplify complex processes.
- Significance: PFDs enhance communication, promote standardization, and help engineers identify inefficiencies and safety issues.
Process Flow Diagrams (PFDs) Overview
In industrial plant engineering, a Process Flow Diagram (PFD) plays a crucial role. It is a specialized flowchart that offers a high-level view of a process system, illustrating the relationships between its major components. Typically used in the chemical processing, oil refining, and various manufacturing industries, PFDs help provide clarity to complex processes by breaking them down into understandable steps.
Purpose of a Process Flow Diagram
The primary objective of a PFD is to graphically represent the flow of materials, energy, and information within an industrial process. A well-designed PFD does more than merely depict equipment and paths; it serves several pivotal functions:
Visual Overview and Process Mapping
A PFD provides a comprehensive visual map of an industrial process by showing:
- The sequence in which process steps occur.
- The major pieces of equipment involved, such as reactors, mixers, heat exchangers, pumps, separators, and compressors.
- Flow directions using arrows that indicate how materials move between different processing stages.
- Basic operating conditions like temperature, pressure, and flow rates often shown as annotations for clarity.
By offering a concise visualization, a PFD helps all stakeholders — from plant operators to design engineers — to quickly grasp complex processes, thus fostering better communication and collaboration.
Facilitating Communication and Documentation
PFDs establish a common language among various teams like design, operations, and maintenance. The universal symbols and standardized layout provide a unified approach that streamlines discussions and documentation. This common framework minimizes misunderstandings and ensures that all parties have a consistent understanding of the process design.
Supporting Process Optimization and Troubleshooting
With the help of a PFD, engineers can easily identify inefficiencies, potential process bottlenecks, and areas of improvement. The diagram highlights redundancies and allows for targeted troubleshooting. Additionally, PFDs serve as the basis for more detailed diagrams such as Piping and Instrumentation Diagrams (P&IDs), making them indispensable during both initial design and subsequent optimization stages.
Components of a Process Flow Diagram
A typical PFD is structured with several key components that collectively encapsulate the process flow. These components include:
Major Equipment
The backbone of any PFD is the depiction of major equipment and units that drive the process. These symbols are standardized in many industries and represent devices including:
- Pumps: Often used to increase the pressure or move liquids through the plant.
- Reactors: Where major chemical reactions occur.
- Heat Exchangers: Devices that transfer heat between fluids.
- Mixers: Equipment that ensures components are uniformly combined.
- Separators: Utilized to divide mixtures into distinct components.
- Compressors: For compressing gases to increase pressure and manage flow.
Flow Paths and Piping
Represented by arrows and connecting lines, flow paths indicate the route material takes through the facility. These paths show how different pieces of equipment are connected and help in understanding process interdependencies. Often annotations indicate whether the flow is continuous or batch-based.
Operational Data and Process Parameters
Details such as temperature, pressure, flow rate, and density are integral to design specifications and operational efficiency. PFDs typically incorporate these variables by:
- Adding text labels near critical equipment or piping.
- Using reference numbers that connect to detailed documents or data sheets.
Control Systems and Safety Considerations
While PFDs usually focus on the overall process rather than minute details, they may indicate control loops or basic safety features. These can include:
- An indication of temperature or pressure control systems using dashed lines to denote control feedback loops.
- Significant bypass lines and recirculation paths that highlight redundant or safety-critical circuits.
Interconnection and Integration with Other Systems
A comprehensive PFD shows not only the central process but also how the process integrates with ancillary systems such as utilities (steam, water, air) and external systems (like waste-handling or quality control processes). This holistic view is central to ensuring optimal operation and maintenance planning.
Significance of Process Flow Diagrams in Industrial Engineering
The value of a Process Flow Diagram extends beyond the confines of just process mapping. Its significance can be appreciated through several dimensions:
Simplifying Complex Processes
One of the primary reasons for adopting PFDs is that they transform complicated industrial processes into simplified representations. By focusing on essential components and their interconnections, engineers can quickly identify critical process steps without being overwhelmed by extraneous detail. This macro view is crucial for initial design phases, safety assessments, and operational scaling.
Enhancing Operational Efficiency
When engineers visualize the entire process on a single diagram, they are better equipped to spot inefficiencies or potential failures. The PFD ensures that:
- Potential bottlenecks are identified early on during the design process.
- Redundant or unnecessary steps can be streamlined or eliminated.
- Maintenance teams have a simplified map which assists in efficient troubleshooting and downtime reduction.
Risk Management and Safety
Safety forms a cornerstone of industrial process management. PFDs help in risk assessment by clearly showcasing process anomalies or points where hazardous conditions might develop. By understanding the precise flow and interactions between components, safety analysts can:
- Develop contingency plans for process failures.
- Ensure that systems are in place to handle abnormal operating conditions.
- Implement safety improvements before full-scale production begins.
Facilitating Training and Knowledge Transfer
New engineers or plant operators benefit greatly from a well-prepared PFD. The diagram provides an accessible overview of the process and ensures that critical operational details are conveyed succinctly. This is particularly valuable in industries with high turnover or where processes are subject to frequent upgrades.
Supporting Regulatory Compliance
Regulatory bodies often require detailed documentation of industrial processes. A comprehensive PFD serves as either a part of, or a supportive document for, meeting these standards. It is used in audits and inspections to showcase adherence to safety, environmental, and operational guidelines.
Sample Illustration of a Process Flow Diagram
To better visualize how a Process Flow Diagram is structured, consider the following simplified example of a chemical process used primarily in a processing plant:
Illustrative Example: Chemical Processing Plant
This example demonstrates a chemical process from raw material input to a final purified product. The process flow is mapped out in a step-by-step manner:
| Process Step | Description | Equipment/Details |
|---|---|---|
| Raw Materials Input | Introduction of chemical reactants and additives | Storage tanks, flow meters |
| Mixing | Combining chemicals uniformly | Mixers, agitators |
| Reaction | Chemical reaction under controlled conditions | Reactors, temperature/pressure controllers |
| Separation | Separation of by-products from the main product | Decanters, centrifuges |
| Purification | Refining the chemical to remove impurities | Distillation columns, filters |
| Final Product | Output of the purified chemical | Packing units, quality control stations |
Diagrammatic Representation
The following diagram illustrates the sequential operations:
// Raw Materials Input
+------------------+
| Raw Materials    |
| (Tanks/Feeders)  |
+------------------+
          |
          v
// Mixing Unit
+------------------+
|     Mixer      |
+------------------+
          |
          v
// Reaction Unit
+------------------+
|    Reactor     |
+------------------+
          |
          v
// Separation Unit
+------------------+
|   Separator    |
+------------------+
          |
          v
// Purification Unit
+------------------+
| Distillation   |
|    Column      |
+------------------+
          |
          v
// Final Product Output
+------------------+
|  Final Product |
+------------------+
In this illustration, each block represents a major process step whereas the arrows define the pathway of the materials. Operational data like temperature or pressure can be annotated adjacent to the blocks, offering additional insight into specific operating conditions.
Integration with Broader Engineering Systems
Process Flow Diagrams not only offer clarity for those directly involved in the process but also integrate seamlessly with broader engineering documentation. They are used as conceptual blueprints for creating more detailed schematics such as:
- Piping and Instrumentation Diagrams (P&IDs): Detailed depictions including instrument connections, control loops, and piping specifics.
- General Arrangement (GA) Diagrams: Layout diagrams illustrating equipment placement and spatial relationships in a facility.
- System Flow Diagrams: Comprehensive maps that extend beyond individual process units to include utility systems and ancillary services.
The integration of these diagrams ensures that every facet of plant engineering, from conceptual design to day-to-day operations, is harmoniously aligned with established safety and operational standards.
References
- EdrawMax - Purposes and Benefits of Process Flow Diagram - EdrawMax
- AutomationForum - Process Flow Diagram - AutomationForum
- Lucidchart - Process Flow Diagrams - Lucidchart
- Asana - Process Flow - Asana
- Wikipedia - Process Flow Diagram - Wikipedia
Recommended Further Queries
Last updated March 6, 2025