
Unlock Trend Reversals: Pine Script Code to Spot SMA Upturns on TradingView
Visualize potential bullish shifts instantly when the 50-day SMA turns positive with this custom indicator.
Highlights
- Automatic Detection: The script identifies the exact moment the 50-day Simple Moving Average (SMA) transitions from a downward or flat trajectory to an upward slope.
- Clear Visual Signals: A vertical green line is plotted directly on your price chart for immediate recognition of potential bullish momentum shifts.
- Customizable & Easy to Use: Easily adjust the SMA length and line appearance within the Pine Script code, and add it to your TradingView chart with a simple copy-paste.
Introducing the SMA Direction Change Indicator
Trading involves identifying potential shifts in market sentiment and trend direction. Moving averages are fundamental tools for this, smoothing price action to reveal underlying trends. This Pine Script indicator focuses specifically on the 50-day Simple Moving Average (SMA), a widely watched intermediate-term trend indicator. Its primary goal is to alert you visually when the momentum of this SMA shifts from negative (decreasing) or flat to positive (increasing).
When the price starts recovering after a decline, the SMA will eventually follow. The point where the SMA stops falling and begins to rise can be a significant technical event, potentially signaling the start of a new uptrend or the resumption of a prior one. This script automates the detection of this precise moment, plotting a distinct vertical green line on the chart bar where the change occurs. This immediate visual cue helps traders quickly identify potential entry points or confirmations of strengthening price action.
Understanding the 50-Day SMA and Direction Changes
What is the Simple Moving Average (SMA)?
The Simple Moving Average (SMA) is a core technical analysis indicator calculated by summing up the closing prices of an asset over a specific number of periods (e.g., 50 days) and then dividing by that number of periods. For a 50-day SMA, it represents the average closing price over the last 50 trading days.
Its primary function is to smooth out short-term price fluctuations and highlight the longer-term trend direction.
- When the price is consistently above the SMA, it generally indicates an uptrend.
- When the price is consistently below the SMA, it suggests a downtrend.
- The slope of the SMA itself also provides valuable information: a rising SMA indicates increasing average prices (bullish momentum), while a falling SMA indicates decreasing average prices (bearish momentum).
Detecting the Shift: From Negative/Flat to Positive Slope
The crucial event this script identifies is the *change* in the SMA's slope from negative (or flat) to positive. This doesn't just mean the SMA value increased from one bar to the next; it specifically targets the inflection point where a period of decline or stagnation ends, and a period of ascent begins.
In Pine Script terms, this is efficiently detected using the `ta.crossover()` function. This function checks if the first series (the current SMA value) has just crossed above the second series (the previous bar's SMA value). Mathematically, this condition (`ta.crossover(smaValue, smaValue[1])`) is true when:
- The current SMA value (`smaValue`) is greater than the previous SMA value (`smaValue[1]`).
- The previous SMA value (`smaValue[1]`) was less than or equal to the SMA value from two bars ago (`smaValue[2]`).
This precise logic ensures we capture the moment the SMA transitions from a non-increasing state (either decreasing or flat) to an increasing state, signaling a potential bullish turn in the underlying average price trend.
The Pine Script Code Explained
Below is the complete Pine Script code designed for TradingView (version 5). It calculates the 50-day SMA, detects the upward turn in its direction, and plots a green vertical line as a signal.
// Specify Pine Script version 5
//@version=5

// Define the indicator properties
indicator(title="SMA Direction Change Signal", shorttitle="SMA Dir Up", overlay=true)

// --- User Inputs ---
// Allow users to customize the SMA length, line color, and width via the indicator settings
length = input.int(50, title="SMA Length", minval=1) // Default SMA length is 50
lineColor = input.color(color.green, title="Line Color") // Default line color is green
lineWidth = input.int(2, title="Line Width", minval=1) // Default line width is 2

// --- Calculations ---
// Calculate the Simple Moving Average based on closing prices and the specified length
smaValue = ta.sma(close, length)

// Detect the bullish crossover: when the current SMA value crosses above the previous SMA value
// This signifies the change from a decreasing or flat slope to an increasing slope.
bullishTurn = ta.crossover(smaValue, smaValue[1])

// --- Plotting ---
// Check if the bullishTurn condition is true for the current bar
if bullishTurn
    // If true, draw a new vertical line on this bar
    line.new(x1=bar_index,      // Start x-coordinate: current bar index
             y1=low,           // Start y-coordinate: low price of the current bar
             x2=bar_index,      // End x-coordinate: current bar index (making it vertical)
             y2=high,          // End y-coordinate: high price of the current bar
             color=lineColor,  // Set the line color based on user input
             width=lineWidth)  // Set the line width based on user input

// --- Optional SMA Plot ---
// Plot the SMA line itself on the chart for reference
plot(smaValue, title="SMA", color=color.new(color.blue, 50), linewidth=1) // Plot SMA in semi-transparent blue
Code Breakdown
Initialization
//@version=5: Declares the script uses Pine Script version 5 features.indicator(...): Sets the name ("SMA Direction Change Signal"), short title ("SMA Dir Up") for the chart legend, and specifies `overlay=true` to draw directly on the main price chart.
User Inputs
input.int()andinput.color(): These functions create settings adjustable by the user in the indicator's options panel without needing to edit the code directly. Users can change the SMA `length`, the signal `lineColor`, and the `lineWidth`.
SMA Calculation
smaValue = ta.sma(close, length): This is the core calculation. `ta.sma()` computes the Simple Moving Average. It takes the data source (`close` price) and the period (`length` from user input) as arguments.
Direction Change Detection
bullishTurn = ta.crossover(smaValue, smaValue[1]): This built-in function efficiently detects when `smaValue` crosses above its value on the previous bar (`smaValue[1]`). It returns `true` on the bar where the crossover occurs, precisely capturing the upward turn from a non-increasing slope.
Conditional Plotting
if bullishTurn: This executes the following code block only on bars where `bullishTurn` is true.line.new(...): This function draws a line segment. By setting `x1` and `x2` to the same `bar_index` (the index of the current bar), it creates a vertical line. `y1=low` and `y2=high` make the line span the vertical range of the price bar. `color` and `width` are set based on user inputs.
Optional SMA Plot
plot(smaValue, ...): This line plots the calculated SMA on the chart, helping users visualize the moving average itself alongside the direction change signals.
Visualizing the Script's Logic
The following mind map illustrates the flow of logic within the Pine Script indicator:
bar_index, low, high,
color, width"] ["If False"] ["Do Nothing"] ["Output"] ["Visual Signal (Green Vertical Line)"] ["Optional: Plotted SMA Line"]
This map shows how the script takes price data and user settings, calculates the SMA, checks for the specific condition of an upward turn using the crossover function, and then conditionally plots the visual signal on the chart.
Visualizing the Signal: The Green Vertical Line
When the script detects that the 50-day SMA has changed direction from negative/flat to positive, it plots a vertical green line directly on the corresponding price bar. This line serves as an immediate, unambiguous visual cue drawing your attention to a potentially significant technical event.
The `line.new()` function is used to create this signal. It draws a line segment between two points (x1, y1) and (x2, y2). To make it vertical and aligned with the price bar:
- X-Coordinates (`x1`, `x2`): Both are set to `bar_index`, the unique identifier for the current bar. This ensures the line is perfectly vertical and positioned at the bar where the signal occurred.
- Y-Coordinates (`y1`, `y2`): These are set to the `low` and `high` prices of the current bar. This makes the vertical line span the full height of the price candle, increasing its visibility.
- Color (`color`): Set to `color.green` (or the user-defined color) to signify a bullish event.
- Width (`width`): Controls the thickness of the line, adjustable by the user for preference.
While the request mentioned a "vertical bar," Pine Script's standard way to highlight a specific bar based on a condition like this is often through shapes (`plotshape`), background coloring (`bgcolor`), or drawing lines (`line.new`). A vertical line spanning the bar's height provides a clear, focused signal without altering the main price bars themselves.
Indicator Characteristics Profile
This radar chart provides a qualitative assessment of the SMA Direction Change indicator across several key characteristics, compared to a standard Moving Average Crossover strategy. Note that these are generalized assessments:
Interpretation:
- Signal Frequency: The SMA Direction change might signal more often than a long-term crossover like the 50/200 day.
- Lag: Both indicators inherently lag price. The direction change signal might occur slightly earlier than a crossover of two MAs, but still significantly after price bottoms.
- Noise Resistance: Moving averages help filter noise. Longer MAs or crossovers generally offer more noise resistance than focusing on the slope change of a single MA.
- Simplicity: Both concepts are relatively simple to understand and implement.
- Customizability: The SMA Direction script allows easy changes to length and visuals. Crossovers offer choices of MA types and lengths.
- Trend Confirmation Strength: A crossover of two MAs (especially longer-term ones) is often considered a stronger trend confirmation signal than a single MA's slope change.
- Early Signal Potential: The direction change focuses on the *start* of the SMA's rise, potentially offering a slightly earlier signal than waiting for one MA to cross another, though still lagging price action itself.
How to Implement and Use on TradingView
Adding this custom indicator to your TradingView chart is straightforward:
- Open Pine Editor: On your TradingView chart, click the "Pine Editor" tab at the bottom of the screen.
- Clear Existing Code: If there's any default code, select it all (Ctrl+A or Cmd+A) and delete it.
- Paste the Code: Copy the complete Pine Script code provided above and paste it into the empty Pine Editor window.
- Save the Script (Optional but Recommended): Click the "Save" button in the Pine Editor toolbar. Give your script a name (e.g., "My SMA Direction Signal").
- Add to Chart: Click the "Add to Chart" button in the Pine Editor toolbar.
The indicator should now appear on your chart. You'll see the 50-day SMA plotted (as a blue line by default), and vertical green lines will appear on bars where the SMA's direction turned positive.
Customization Options
You can easily adjust the indicator's parameters without editing the main logic:
- Hover over the indicator's name in the top-left corner of your chart.
- Click the "Settings" (gear) icon that appears.
- In the "Inputs" tab of the settings window, you can:
- Change the "SMA Length" from 50 to any other period (e.g., 20, 100).
- Modify the "Line Color" used for the vertical signals.
- Adjust the "Line Width" for better visibility.
- You can also adjust the appearance (color, thickness) of the plotted SMA line itself under the "Style" tab.
Considerations for Effective Use
- Timeframes: While the script works on any timeframe, a 50-period SMA is typically analyzed on Daily (50-day SMA) or Weekly charts. Using it on very short timeframes (like 1-minute) will make the SMA react much faster and potentially generate more frequent, less reliable signals.
- Confirmation is Key: This indicator should not be used in isolation. SMA direction changes are just one piece of the puzzle. Always seek confirmation from other technical indicators (like RSI, MACD, Volume), price action patterns (like candlestick formations, support/resistance breaks), or fundamental analysis.
- Lagging Nature: Remember that all moving averages are lagging indicators. The signal will appear *after* the price has already started to move. It confirms a potential change rather than predicting it.
- Whipsaws: In choppy or sideways markets, the SMA might frequently change direction, leading to multiple "whipsaw" signals (false positives). It tends to perform better in trending markets.
- Context Matters: Consider the overall market structure. An SMA turning up might be more significant if it occurs after a prolonged downtrend or near a major support level.
Signal Comparison Table
Understanding how the SMA Direction Change signal compares to other common technical signals can help in building a trading strategy. Here's a brief comparison:
| Signal Type | Indicator(s) Used | Typical Meaning | Pros | Cons |
|---|---|---|---|---|
| SMA Direction Change (Negative to Positive) | Single SMA (e.g., 50-period) | Potential start of bullish momentum in the average price trend. | Focuses on the inflection point; potentially earlier than crossovers. Relatively simple. | Lagging indicator; can whipsaw in choppy markets; signal strength varies. |
| Moving Average Crossover (e.g., 50-day crosses above 200-day) | Two MAs (Short-term & Long-term) | Confirmation of a potentially stronger, longer-term trend shift (Golden Cross). | Filters more noise; considered a stronger confirmation signal. | Significant lag; signals are infrequent; may miss initial part of the move. |
| RSI Exits Oversold | Relative Strength Index (RSI) | Indicates potential bounce after price was deemed "oversold" (typically below 30). | Momentum-based; can identify potential turning points relatively early. | Can give false signals in strong downtrends; oversold doesn't guarantee reversal. |
| MACD Bullish Crossover | Moving Average Convergence Divergence (MACD) | MACD line crosses above the Signal line, indicating potential upward momentum. | Combines trend-following and momentum; provides histogram for strength. | Lagging; can whipsaw; effectiveness varies by market conditions. |
Understanding SMAs in Pine Script
The following video provides a helpful introduction to working with Simple Moving Averages (SMAs) within the TradingView Pine Script environment. While it covers the basics, understanding how SMAs are calculated and plotted in Pine Script is fundamental to customizing or building upon the direction change indicator provided here.
This tutorial walks through creating a basic Pine Script indicator, explaining the `sma()` function, and plotting the result on the chart. Watching it can solidify your understanding of how the `ta.sma(close, length)` part of our script works, making you more comfortable with potentially modifying the length or source price used in the calculation.
Identifying Trends with Moving Averages
Moving averages, like the 50-day SMA used in our script, are essential tools for identifying the prevailing market trend. The image below illustrates a typical bullish trend characterized by price consistently staying above a rising moving average.
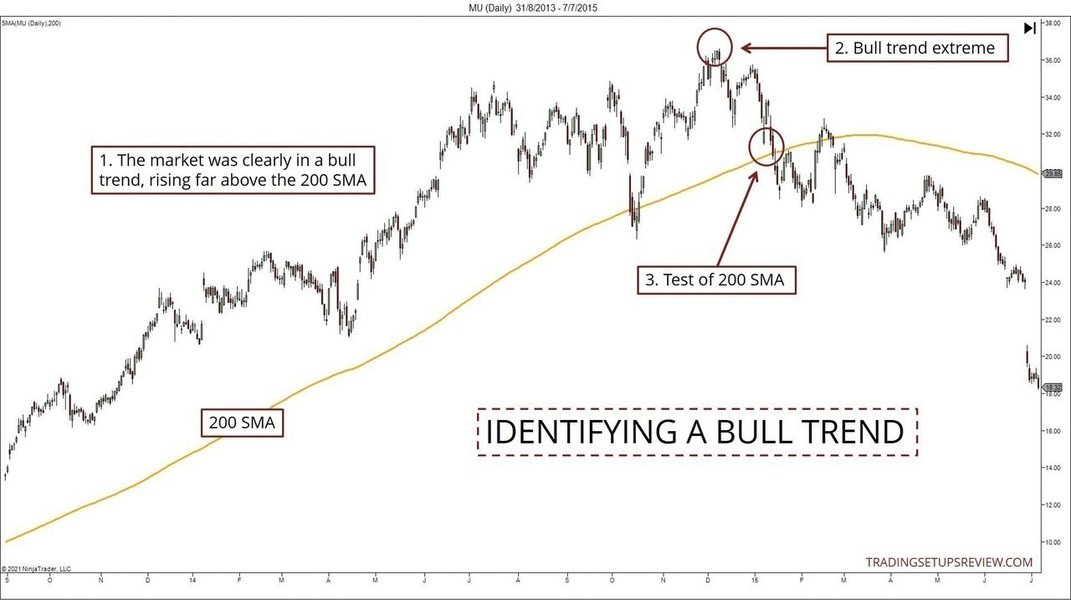
In a healthy uptrend:
- Price generally remains above the chosen moving average (e.g., 50-day SMA).
- The moving average itself slopes upwards.
- Pullbacks often find support near the moving average.
The script we've discussed focuses on a specific event within this context: the moment the SMA *starts* sloping upwards after a period of decline or consolidation. This signal can indicate:
- Potential Trend Reversal: After a downtrend, the first instance of the SMA turning up might signal that the worst of the decline is over and a bottoming process is underway.
- Trend Resumption: During an existing uptrend, if the price consolidates or pulls back causing the SMA to flatten or briefly dip, the signal occurs when the SMA resumes its upward trajectory, confirming the continuation of the primary trend.
By plotting a vertical line at these inflection points, the script helps traders visually confirm when the underlying average price momentum, as measured by the 50-day SMA, shifts back in a bullish direction, complementing visual trend analysis like that shown in the image.
Frequently Asked Questions (FAQ)
What is Pine Script?
Can I change the SMA period from 50 days?
Can I change the SMA period from 50 days?
Is this indicator a complete trading strategy?
Will the vertical lines change or disappear after they are plotted (repaint)?
References
- Simple Moving Average in Pine Script - TradingCode.net
- Using the ta.crossover Function in Pine Script - Pine Wizards
- Pine Script™ v5 User Manual - TradingView
- How to draw a vertical line in TradingView pine script - Stack Overflow
- Pine Script User Guide TradingView - Forex.com
- Pine Script Tutorial: The Basics & Beyond [2024] - AlgoTrading101
Recommended
Last updated April 11, 2025