
Unlock Trading Signals: Mastering the POC Wave 3-Bar Setup on the 1-Hour Chart
Combine Volume Profile's Point of Control with a classic price pattern for enhanced market analysis.
Understanding market dynamics involves layering different analytical techniques. Combining Volume Profile analysis, specifically the Point of Control (POC), with price action patterns like the 3-bar setup can offer valuable insights, especially on timeframes like the 1-hour chart. The term "POC Wave" can refer to tracking the movement of the POC over time or integrating POC analysis with wave-based indicators. Let's break down this combined approach.
Highlights: Key Insights
- POC is Paramount: The Point of Control (POC) identifies the price level with the highest traded volume, acting as a crucial magnet for price and a potential support/resistance zone.
- 3-Bar Structure: The 3-bar setup is a concise price action pattern indicating potential continuations or reversals after a brief pause, consisting of an impulse, a pullback, and a confirmation bar.
- Synergistic Strategy: Combining POC analysis (including its potential "wave-like" migration) with the 3-bar setup on a 1-hour chart allows traders to pinpoint entries where volume consensus meets price action confirmation.
Unpacking the Components: POC and Volume Profile
What is the Point of Control (POC)?
The Point of Control (POC) is a cornerstone concept derived from Volume Profile analysis. It represents the single price level within a specified period (e.g., a trading session, a day, a week, or even a single bar) where the highest volume of transactions occurred. Think of it as the market's 'fairest' price during that period, the level where buyers and sellers agreed most actively.
Significance in Trading
The POC acts as a significant reference point for traders:
- Support and Resistance: It often serves as a strong level of support or resistance. Price tends to gravitate towards the POC, and reactions upon reaching it can signal potential reversals or continuations.
- Market Equilibrium: It highlights the price level of maximum consensus or equilibrium. Significant deviations from the POC might indicate a market imbalance or the start of a new trend.
- Confirmation Tool: It can be used to confirm trade setups derived from other analysis methods. For example, a candlestick pattern forming near a POC level gains added significance.
Identifying POC with Volume Profile
The POC is identified using Volume Profile tools available on most modern charting platforms. These tools analyze the total volume traded at each price level over a selected time range and display it as a horizontal histogram overlaid on the price chart. The longest bar in this histogram corresponds to the POC level.
Common Volume Profile indicators include:
- Volume Profile Visible Range (VPVR): Calculates the volume profile for the price data currently visible on the chart.
- Volume Profile Session Volume (VPSV): Calculates the volume profile for each trading session (e.g., daily).
- Volume Profile Fixed Range (VPFR): Allows the user to manually select a specific start and end point on the chart to calculate the volume profile for that exact range.
The peak of the volume histogram generated by these tools clearly marks the POC.
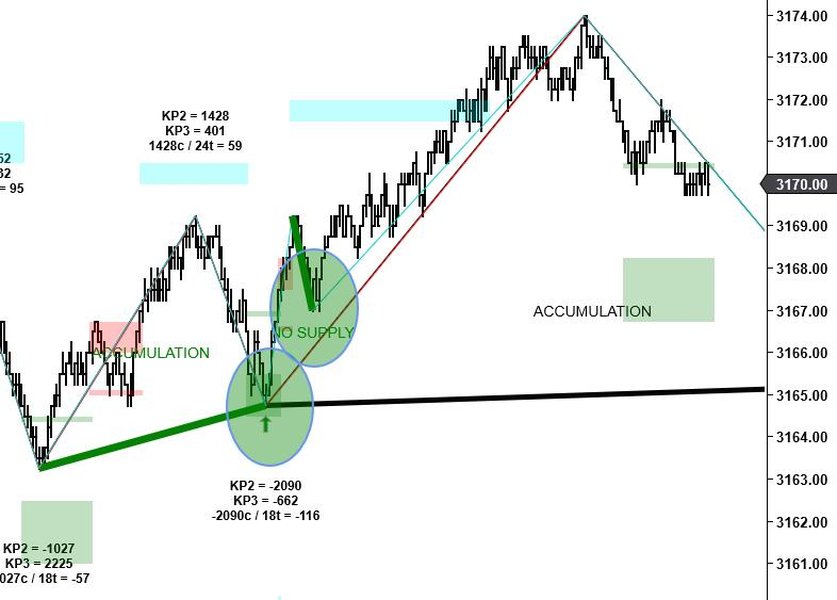
Price interacting with Point of Control (POC) levels, often forming distinct patterns.
Focusing on the 1-Hour Chart: POC Placement
Methods for 1-Hour POC Identification
Applying POC analysis to a 1-hour chart requires deciding the period over which the volume profile should be calculated. Common approaches include:
Session-Based Profiles
Using indicators like VPSV, you can see the POC for each distinct trading session (often daily) plotted on your 1-hour chart. This shows the most significant level for the entire session's activity.
Fixed or Rolling Profiles
You can use the Fixed Range tool to define specific periods relevant to your analysis (e.g., the last 24 hours, the current week's range so far) or use a rolling profile that calculates over a set number of recent bars (e.g., the last 20 hourly bars). Some platforms offer indicators that specifically plot the POC from a higher timeframe (like daily or weekly) onto the 1-hour chart.
Using Charting Tools
On platforms like TradingView, you can apply the VPVR, VPSV, or Fixed Range tools. Configure them to suit your analysis period. The indicator will display the volume histogram, and the POC will be the most prominent level, often highlighted automatically. For instance, applying VPFR over the last 24 hourly bars will show the POC for that specific day-long period.
Deciphering the "3-Bar Setup"
The "3-Bar Setup," often referred to as the "3 Bar Play," is a common short-term price action pattern used to identify potential entry points after a strong directional move followed by a brief consolidation or pullback.
Structure of the Pattern
The pattern typically consists of three consecutive price bars (candles) on the chosen timeframe (in this case, 1-hour bars):
Bar 1: The Impulse
This is usually a large-bodied bar with significant range, moving strongly in one direction (either bullish or bearish). Ideally, this bar occurs on increased volume, indicating conviction behind the move.Bar 2: The Pause or Pullback
This bar follows the impulse bar and typically has a smaller range. It represents a temporary pause, consolidation, or minor pullback against the direction of Bar 1. It might be an inside bar (range contained within Bar 1's range) or show a slight retracement. Low volume on this bar can suggest the pullback lacks strength.Bar 3: The Confirmation
This bar signals the potential resumption of the initial move.- In a bullish setup (after a strong up-move in Bar 1), Bar 3 breaks above the high of Bar 2 (and ideally Bar 1), confirming buying interest.
- In a bearish setup (after a strong down-move in Bar 1), Bar 3 breaks below the low of Bar 2 (and ideally Bar 1), confirming selling pressure.
This pattern provides a structured way to enter a potential trend continuation after the market takes a brief 'breath'.
Understanding the "Wave" Aspect
The term "Wave" in the context of "POC Wave" can be interpreted in a few ways, often relating to market dynamics or auxiliary indicators:
Tracking POC Migration
One interpretation is to observe how the POC level shifts or "migrates" over consecutive time periods (e.g., from one 1-hour bar/session to the next). This is sometimes called POC migration or tracking the "wave" of value acceptance.
- Upward Migration: If the POC consistently moves higher over several periods, it suggests buyers are becoming more aggressive and value is being accepted at higher prices (bullish sentiment).
- Downward Migration: If the POC consistently moves lower, it indicates sellers are dominant and value is being accepted at lower prices (bearish sentiment).
- Stable POC: A POC remaining relatively static suggests market balance or consolidation.
Observing this "wave" of POC movement provides context about the underlying strength and direction of market participation.
Confluence with Oscillators
Another interpretation involves using the POC in conjunction with momentum oscillators, sometimes referred to as "wave" indicators (like the Elliott Wave Oscillator, MACD, RSI, or specific custom indicators like the "Quantum Wave" mentioned in some sources). The idea is to look for confirmation between the POC level (acting as support/resistance) and signals from the oscillator (e.g., divergences, overbought/oversold conditions, zero-line crosses). A 3-bar setup gains strength if it occurs at the POC while the oscillator simultaneously provides a corroborating signal.
Synthesizing the Strategy: The POC Wave 3-Bar Setup
Combining these elements provides a trading strategy that leverages both volume-based structure (POC) and price action (3-bar setup), potentially refined by observing POC migration or oscillator signals ("Wave").
Combining Volume Insight with Price Action
The core idea is to use the POC identified on the 1-hour chart as a key level of interest. The 3-bar setup occurring near this POC level can signal a high-probability trading opportunity, as it suggests that price action is confirming the significance of the high-volume node.
Setup Identification Steps (1-Hour Chart)
- Identify the POC: Use Volume Profile tools (VPVR, VPSV, VPFR) on your 1-hour chart to determine the relevant POC for your analysis period (e.g., session POC, recent range POC). Mark this level clearly.
- Observe POC Context ("Wave"): Note if the POC has been migrating upwards, downwards, or staying stable over recent periods. Check if relevant oscillators are indicating potential momentum shifts or confirming the current trend.
- Spot the 3-Bar Pattern: Watch for the formation of the 3-bar setup (Impulse, Pause/Pullback, Confirmation) developing near the identified POC level.
- Analyze Interaction with POC: Pay close attention to how the pattern interacts with the POC. Ideally, Bar 2 (the pullback) respects the POC level (e.g., finds support at POC in a bullish setup, or resistance at POC in a bearish setup).
- Confirmation and Entry: Bar 3 provides the trigger. A break above Bar 2's high (bullish) or below Bar 2's low (bearish), especially if it moves decisively away from the POC, signals a potential entry. Consider volume on Bar 3 – increased volume adds conviction. Oscillator confirmation can further enhance the signal.
- Risk Management: Place stop-loss orders appropriately, often just beyond the POC level or the extreme of the 3-bar pattern (e.g., below Bar 2's low for a long entry, above Bar 2's high for a short entry). Potential targets can be the next significant POC, Value Area levels (VAH/VAL), or other support/resistance zones.
Trading Scenarios
Bullish POC Wave 3-Bar Setup Example
- Context: Price is in an uptrend or consolidating after an up-move. POC is stable or migrating upwards.
- Bar 1: Strong bullish bar approaches or tests the POC from below.
- Bar 2: Smaller pullback bar holds above or bounces off the POC level (POC acts as support).
- Bar 3: Bullish bar breaks above the high of Bar 2, confirming the bounce off POC.
- Entry: Long on the break of Bar 2's high. Stop-loss below POC or Bar 2's low.
Bearish POC Wave 3-Bar Setup Example
- Context: Price is in a downtrend or consolidating after a down-move. POC is stable or migrating downwards.
- Bar 1: Strong bearish bar approaches or tests the POC from above.
- Bar 2: Smaller pullback bar fails to break above the POC level (POC acts as resistance).
- Bar 3: Bearish bar breaks below the low of Bar 2, confirming the rejection at POC.
- Entry: Short on the break of Bar 2's low. Stop-loss above POC or Bar 2's high.
Here's a table summarizing the key characteristics for quick reference:
| Feature | Bullish Setup | Bearish Setup |
|---|---|---|
| Context | Uptrend / Consolidation after up-move. POC stable or rising. | Downtrend / Consolidation after down-move. POC stable or falling. |
| Bar 1 | Strong bullish bar towards/testing POC. | Strong bearish bar towards/testing POC. |
| Bar 2 | Pullback, holds above/tests POC as support. Small range. | Pullback, fails below/tests POC as resistance. Small range. |
| POC Interaction | POC acts as support during Bar 2 pullback. | POC acts as resistance during Bar 2 pullback. |
| Bar 3 | Breaks above Bar 2 high. Confirms bounce. | Breaks below Bar 2 low. Confirms rejection. |
| Entry Trigger | Breakout above Bar 2 high. | Breakdown below Bar 2 low. |
| Volume/Oscillator | Ideally, increased volume on Bar 3 breakout. Bullish oscillator confirmation helpful. | Ideally, increased volume on Bar 3 breakdown. Bearish oscillator confirmation helpful. |
Visualizing Key Relationships: Mindmap
This mindmap illustrates the core concepts and their connections within the POC Wave 3-Bar Setup strategy:
Assessing Setup Reliability: Contributing Factors
The reliability of the POC Wave 3-Bar setup isn't guaranteed; several factors influence its potential success. This chart visualizes the relative importance of key elements contributing to a higher probability setup:
Key takeaways from the chart: The strength and clarity of the POC itself, along with a well-defined 3-bar pattern and strong confirmation on Bar 3, are highly influential. Supporting factors like volume, trend alignment, POC migration, and oscillator confluence further increase the setup's probability.
Video Deep Dive: POC Indicator Strategy
For a visual guide on using Point of Control indicators and strategies, the following video provides insights into applying POC concepts in trading analysis, which can complement the understanding of the POC Wave 3-Bar setup. It likely covers how to identify POC using indicators on platforms like TradingView and potentially discusses strategies based on price interaction with this key level.
Watching this can help solidify the practical application of identifying and utilizing the POC on your charts, which is fundamental to implementing the combined strategy discussed here.
Frequently Asked Questions (FAQ)
What exactly is the Point of Control (POC)? +
The Point of Control (POC) is the price level within a specific chart period (like a day, session, or custom range) where the highest amount of trading volume occurred. It represents the price of greatest agreement between buyers and sellers and often acts as a significant level of support or resistance.
How is the POC placed or identified on a 1-hour chart? +
You use a Volume Profile indicator (like VPVR, VPSV, or VPFR) on your charting platform. Apply the indicator to your 1-hour chart, selecting the desired calculation period (e.g., the visible range, the current session, or a fixed number of past bars). The indicator will draw a horizontal histogram showing volume at each price level; the longest bar/peak of this histogram indicates the POC level for that period.
What constitutes the "3-Bar Setup"? +
It's a three-candle price action pattern typically consisting of:
1. Bar 1: A strong impulse bar (large body, directional move).
2. Bar 2: A smaller pause or pullback bar, often with reduced range/volume.
3. Bar 3: A confirmation bar that breaks beyond Bar 2 (above its high for bullish, below its low for bearish), signaling potential continuation of Bar 1's direction.
What does "Wave" mean in the "POC Wave" context? +
It can have a couple of interpretations:
1. POC Migration: Referring to the observation of how the POC level shifts ("waves") up or down over consecutive periods, indicating changes in value perception.
2. Oscillator Integration: Referring to using the POC in conjunction with momentum oscillators or "wave" indicators (like MACD, RSI, Elliott Wave Oscillator) for confirmation signals.
It generally implies adding a dynamic or confirming element to the basic POC analysis.
Is this different from the "POC Wave" in Order Flow analysis? +
Yes, potentially. Some sources (like Answer D) describe a specific "POC Wave" setup within Order Flow trading. That setup focuses on the POC *within each individual bar* of a three-bar sequence and specific color/POC placement rules (e.g., Red bar, Green bar with lower POC, Green bar). The approach described here focuses on the POC derived from a broader Volume Profile period interacting with a more general 3-bar price action pattern. While both use POC and three bars, the calculation and interpretation differ significantly.
References
- How To Trade The Point of Control (POC) - Trader Dale
- POC Trading Explained - Pi P P E N G U I N Trading
- Strategy | Quantum Wave Guide - QuantumWave Docs
- The Three Bar Play Pattern Explained - PrimeXBT
- Volume Profile Indicator Scripts - TradingView
- Volume Profile - A Complete Guide For Traders - Jumpstart Trading
- Time & volume POC Tutorial - Quantify Tools
Recommended Further Exploration
Last updated April 21, 2025