
Exploring the POC Wave: A 3-Bar Setup for Trading
Unpacking the Point of Control's Role in Identifying Potential Market Turns
Key Insights into the POC Wave
- Point of Control (POC) is paramount: The POC represents the price level with the highest traded volume within a specific period, acting as a magnet for price and a potential area of support or resistance.
- The 3-bar setup is key: The POC Wave specifically analyzes the positioning of the POC across three consecutive price bars to identify potential reversals or continuations.
- Order flow analysis enhances the setup: Understanding the underlying order flow at the POC levels provides deeper context and can increase the reliability of the POC Wave signal.
In the dynamic world of trading, identifying potential market turning points is crucial for successful strategies. The POC Wave, a specific 3-bar setup that focuses on the placement of the Point of Control (POC), offers a method to analyze volume and price interaction for this purpose. This approach, often used on price charts, particularly in conjunction with order flow analysis, can provide valuable insights into market sentiment and potential future price movements. While the user's query specifically mentions a 1-hour chart, the principles of the POC Wave can be applied across various timeframes.
Understanding the Point of Control (POC)
The Core of Volume Profile Analysis
Before delving into the POC Wave, it's essential to grasp the concept of the Point of Control (POC). The POC is a fundamental component of Volume Profile, an advanced charting indicator that visualizes trading activity at specific price levels over a defined period. Essentially, the POC marks the price level where the highest volume of trades occurred during that period. This level is often considered a significant area of market agreement or fair value, and price tends to gravitate towards or react to it.
Volume Profile indicators display this trading activity as a horizontal histogram on the price axis. The bars of the histogram represent the volume traded at each price level, with the longest bar indicating the POC. Other key components of Volume Profile include the Value Area (VA), which represents the price range where a specified percentage of the total volume was traded (commonly 70%), and the Value Area High (VAH) and Value Area Low (VAL), which are the upper and lower boundaries of the Value Area.
The significance of the POC lies in its ability to highlight areas of high liquidity and potential support or resistance. When price approaches a previously established POC, traders often anticipate a reaction as market participants who traded heavily at that level may defend their positions. This makes the POC a valuable level for identifying potential reversals or continuations of trends.
Different Types of POC
It's worth noting that the POC can be calculated for different timeframes and contexts. There can be a POC for an entire trading session, a specific range of bars, or even for individual bars. The user's query specifically focuses on the POC within the context of a 3-bar setup, which analyzes the POC's position on a bar-by-bar basis over a short sequence.
Furthermore, within order flow analysis, distinctions are sometimes made between Volume Point of Control (VPOC) and Time Point of Control (TPOC). While VPOC is based purely on traded volume, TPOC is based on the amount of time price spent at a particular level. In the context of the POC Wave and most volume profile applications, the focus is typically on the Volume Point of Control.
The POC Wave: A 3-Bar Setup Explained
Analyzing POC Placement for Trading Signals
The POC Wave is an order flow pattern that specifically examines the location of the Point of Control across three consecutive price bars. The premise is that the movement and positioning of the POC within these three bars can signal potential shifts in market momentum or indicate areas of price rejection and acceptance.
While the exact criteria for a "POC Wave" setup can vary slightly depending on the specific trading methodology or indicator used, the core idea revolves around analyzing how the POC shifts or remains stable relative to the price action within these three bars. This setup is often used in conjunction with order flow tools that provide detailed insights into buying and selling pressure at each price level.
One interpretation of a bullish POC Wave might involve observing the POC moving higher across the three bars, potentially accompanied by increasing bullish volume or absorption of selling pressure. Conversely, a bearish POC Wave could show the POC moving lower, suggesting increasing bearish control or rejection of higher prices.
The POC Wave is considered a setup that can help identify potential market turning points, particularly after a period of tentative price action or a fake breakout/breakdown. By analyzing the subtle shifts in where the most volume is being traded within a short timeframe, traders look for clues about the market's intended direction.
Understanding POC Wave Analysis with Orderflows Trader
This video provides a visual explanation of how the POC Wave can be analyzed using specific trading software that incorporates order flow analysis. It highlights how the positioning of the Point of Control across multiple bars can be interpreted to identify potential trading opportunities.
Contextualizing the 3-Bar Setup
The 3-bar setup itself is a common element in various trading patterns. For instance, the "Three-Bar Reversal" pattern is a price action pattern that uses the relationship between three consecutive bars to signal a potential trend change. While the POC Wave specifically incorporates volume analysis through the POC, the concept of analyzing a short sequence of bars for a signal is similar.
In the context of the POC Wave, the focus is not just on the price highs and lows of the three bars, but on the price levels within those bars where the most volume was concentrated. This adds a layer of volume-based confirmation to the price action analysis.
Trading Strategies Utilizing the POC Wave
Integrating POC Analysis into Your Trading Plan
Trading the POC Wave involves identifying the specific 3-bar setup on the price chart and interpreting the significance of the POC's placement. Traders often look for the POC Wave to occur at key areas, such as previous support or resistance levels, trendlines, or in conjunction with other technical indicators.
A common strategy involves waiting for the price to move away from a significant POC and then looking for a POC Wave setup during a pullback back to that level. The idea is that the original POC represents an area where significant volume was traded, and a retest of this level, accompanied by a supportive POC Wave, could indicate a continuation of the initial move.
Entry and Exit Considerations
Entry points for a POC Wave strategy would typically be based on the completion of the 3-bar pattern and the confirmation from order flow data. For example, a bullish POC Wave at a support level might trigger a long entry. Stop-loss orders are crucial for managing risk and could be placed below the low of the setup or another relevant volume node.
Target levels can be determined using various methods, including previous swing highs or lows, Fibonacci extensions, or other volume profile levels like the Value Area High or Low of a larger timeframe. Position sizing is also critical and should be based on the trader's risk tolerance and account size.
It's important to remember that no trading strategy is foolproof, and the POC Wave should not be used in isolation. Combining it with other forms of analysis, such as overall market structure, trend analysis, and other order flow indicators, can significantly improve its effectiveness.
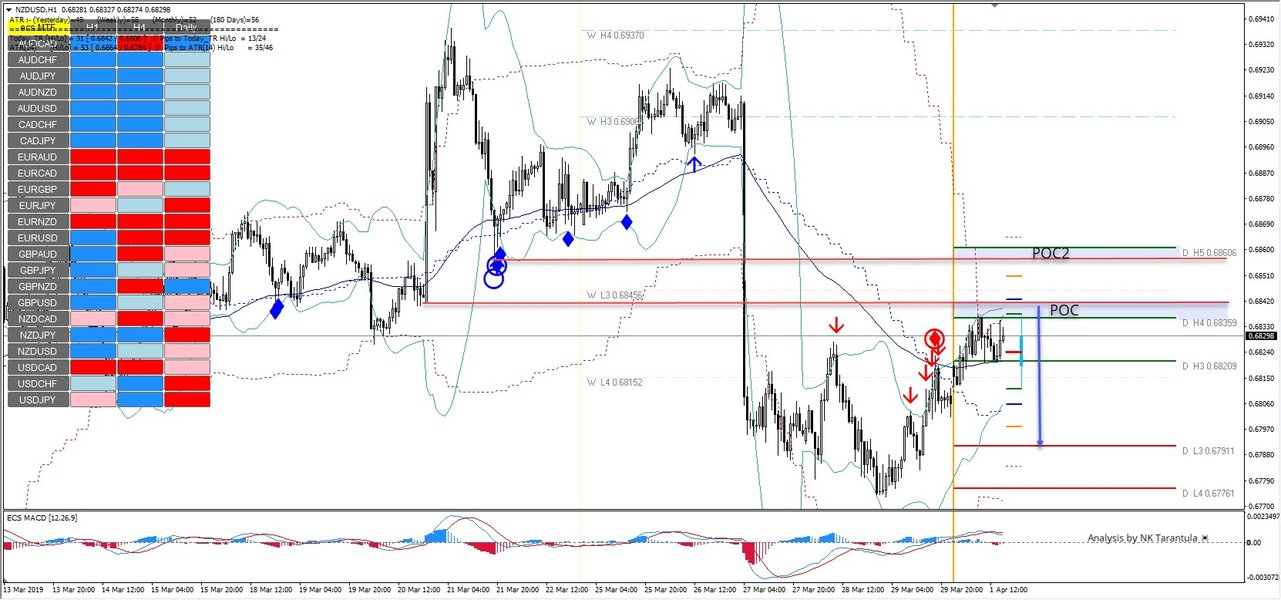
This image illustrates how POC zones can act as areas of resistance, a concept relevant when considering where POC Wave setups might occur or react to.
POC Wave and Timeframes
Applying the Setup to Different Chart Periods
While the user specifically inquired about a 1-hour price chart, the concept of the POC Wave and analyzing POC placement across multiple bars can be applied to various timeframes. Traders may use the POC Wave on shorter timeframes, such as 5-minute or 15-minute charts, for day trading strategies, or on longer timeframes, such as 4-hour or daily charts, for swing trading.
The key is to understand that the significance of the POC and the POC Wave setup can vary depending on the timeframe. A POC on a daily chart represents a much larger volume concentration over a longer period compared to a POC on a 5-minute chart. Therefore, a POC Wave occurring on a higher timeframe may have more significant implications than one on a lower timeframe.
Some traders may even look for confluence between POC Waves on different timeframes. For instance, a bullish POC Wave on a 1-hour chart coinciding with the price retesting a significant daily POC could be considered a higher-probability trading opportunity.
Integrating Order Flow Analysis with the POC Wave
Gaining Deeper Market Insights
The effectiveness of the POC Wave is significantly enhanced when combined with detailed order flow analysis. Order flow tools provide granular data on executed trades, showing the volume traded at each price level within a bar, as well as imbalances between buying and selling pressure.
Analyzing the order flow in conjunction with the POC Wave allows traders to understand the dynamics behind the POC's placement. For example, a bullish POC Wave might be more convincing if the order flow data shows significant buying pressure and absorption of selling at the POC levels within the three bars.
Concepts like Delta (the difference between buying and selling volume) and Volume Clusters can provide additional confirmation for POC Wave setups. A positive Delta at the POC of a bullish POC Wave, or the presence of significant volume clusters below the POC, could further strengthen the bullish signal.
Tools for Order Flow and POC Analysis
Specialized trading platforms and indicators are often used to effectively analyze order flow and the POC. These tools provide visual representations of volume at price, allowing traders to easily identify POCs and analyze the order flow dynamics within specific bars and ranges. Examples of such tools are available and are designed to help traders gain a deeper understanding of market activity beyond just price charts.
Considerations and Limitations
Understanding the Nuances of POC Wave Trading
While the POC Wave can be a valuable tool, it's important to be aware of its limitations. Like any trading setup, it does not guarantee future price movements. Market conditions can change rapidly, and false signals can occur.
The interpretation of the POC Wave can also be subjective, and different traders may have slightly different criteria for identifying and trading the setup. It requires practice and experience to accurately interpret the meaning of POC placement in the context of overall market dynamics.
Furthermore, the effectiveness of the POC Wave can depend on the specific instrument being traded and the prevailing market volatility. It may be more effective in markets with high volume and clear areas of institutional participation.
Frequently Asked Questions about the POC Wave and POC Trading
What is the primary significance of the Point of Control (POC)?
The POC signifies the price level where the highest volume of trading activity occurred within a specified period. It represents a point of market agreement or fair value and can act as a significant support or resistance level.
How does the POC Wave setup work?
The POC Wave is a 3-bar setup that analyzes the position and movement of the Point of Control across three consecutive price bars. It is used to identify potential market turning points or confirm price rejection/acceptance based on where the most volume was traded within that short sequence of bars.
What timeframes can the POC Wave be used on?
While the user asked about a 1-hour chart, the principles of the POC Wave can be applied to various timeframes, from short-term charts like 5-minute or 15-minute charts to longer timeframes such as 4-hour or daily charts. The significance of the setup may vary depending on the timeframe.
Is order flow analysis necessary for trading the POC Wave?
While it's possible to identify the POC Wave using standard volume profile indicators, combining it with detailed order flow analysis significantly enhances its effectiveness. Order flow provides deeper insights into the buying and selling pressure at the POC levels, offering confirmation and a better understanding of the underlying market dynamics.
What are the risks associated with trading the POC Wave?
Like any trading strategy, the POC Wave is not without risk. False signals can occur, and market conditions can change unexpectedly. It's crucial to use proper risk management techniques, such as setting stop-loss orders and managing position sizes, and to avoid using the POC Wave in isolation.
References
Last updated April 21, 2025