
Mastering POC Wave and 3 Bar Setups on the 1-Hour Chart
Leveraging Point of Control for High-Probability Trading Opportunities
The Point of Control (POC) is a critical component within the Volume Profile indicator, representing the price level where the highest volume of trading activity has occurred over a specified period. Understanding and utilizing the POC, especially on a 1-hour chart, can provide traders with valuable insights into market sentiment and potential support and resistance areas. This guide will delve into the POC Wave and 3 Bar setups, focusing on how the placement of the POC influences these strategies for enhanced trading decisions.
Key Insights into POC Trading Strategies
- Point of Control Significance: The POC signifies the price level with the highest traded volume, acting as a magnet for price and often serving as a strong support or resistance area.
- POC Wave and 3 Bar Setups: These specific trading strategies utilize the POC in conjunction with price action to identify potential entry and exit points on a 1-hour chart.
- Strategic POC Placement: The location of the POC within price patterns, such as inside bars or extensions, provides crucial context for anticipating market movements.
Understanding the Point of Control (POC)
At its core, the Point of Control (POC) is derived from the Volume Profile, a charting tool that visualizes trading activity across different price levels over a given timeframe. The POC specifically highlights the single price level where the greatest volume of transactions took place. This level is often considered the "fairest price" or the area of greatest market agreement during the observed period. Traders pay close attention to the POC because price frequently interacts with this level, often showing support or resistance.
The Volume Profile, and consequently the POC, can be applied to various timeframes. For a 1-hour chart, the Volume Profile would display the volume distribution for each 1-hour candle or a specified aggregation of 1-hour candles, with the POC marking the highest volume price within that chosen period. This granular view on a 1-hour chart allows for identifying significant volume nodes that can influence short-term price movements.
Unlike simple horizontal support and resistance lines based on historical price highs and lows, the POC is dynamic and volume-weighted. It reflects where the actual trading activity was concentrated, offering a more nuanced understanding of market structure.
POC as Support and Resistance
One of the primary uses of the POC is identifying potential support and resistance levels. When price approaches a previously established POC, traders often anticipate a reaction.
Testing the POC
A retest of the POC can present trading opportunities. If price approaches the POC from above and finds buying pressure, the POC acts as support. Conversely, if price approaches from below and encounters selling pressure, it acts as resistance. However, it's important to note that the strength of a POC as support or resistance can diminish after multiple tests. Some traders prefer trading the first test of a POC due to potentially higher win rates.
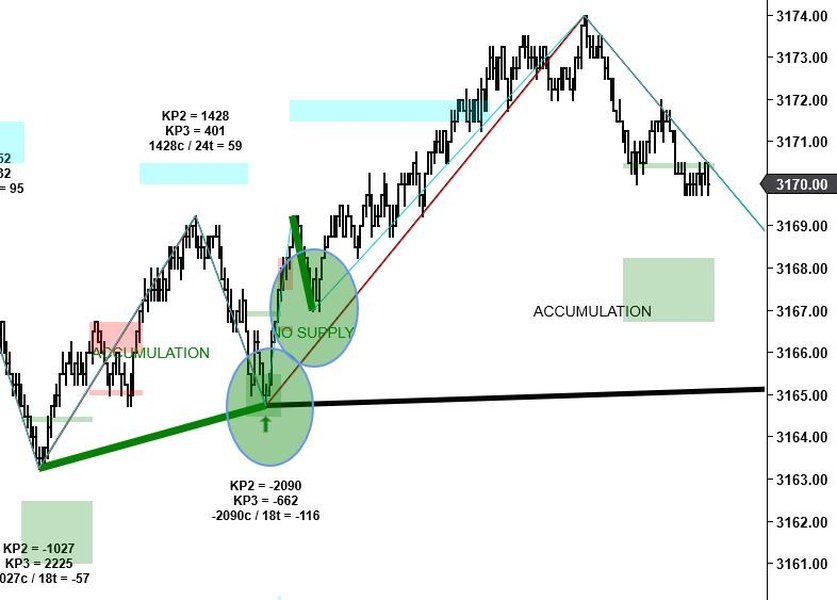
Illustrating potential POC interactions with price.
Exploring the POC Wave Strategy
The POC Wave strategy focuses on the movement of the POC itself and its relationship with price action. As new volume enters the market within each time period (e.g., each 1-hour candle), the POC can shift. The "POC Wave" refers to the visual pattern created by plotting the POC of consecutive candles or time periods.
Analyzing the direction and consistency of the POC Wave can provide clues about the prevailing market sentiment and the strength of a trend. For instance, a steadily rising POC Wave in conjunction with rising prices suggests bullish control, while a falling POC Wave with declining prices indicates bearish dominance.
Order flow analysis, which examines the flow of buy and sell orders, is often integrated with POC Wave analysis. The POC in order flow represents the price level within a bar or candle where the most volume was traded. By observing how volume accumulates at the POC and how the POC shifts with order flow, traders can gain deeper insights into the conviction of market participants. Specific order flow patterns around the POC, such as significant volume at the extreme of a candle with the POC located there (POC in the Wick), can signal potential reversals or continuations.
A video discussing POC Wave analysis in order flow trading.
Trading the POC Wave
Trading strategies based on the POC Wave often involve identifying instances where price is moving away from a significant or "naked" POC (a POC that has not been revisited by price since its formation). When price moves away from a POC, and then later returns to test it, this retest can be a trading opportunity. The direction of the trade (long or short) would depend on the context of the price action and the overall trend indicated by the POC Wave.
Identifying Significant POCs
Not all POCs are equally significant. POCs formed during periods of high volume and tight price consolidation are generally considered more important than those formed during low-volume, choppy markets. Identifying these significant POCs on the 1-hour chart is crucial for the POC Wave strategy. Developing POCs (dPOC) show how the POC changes throughout the formation of a bar or period, offering a dynamic view of volume accumulation.
Implementing the 3 Bar Setup with POC
The 3 Bar setup, also known as the 3 Bar Play, is a price action pattern that can be combined effectively with POC analysis on a 1-hour chart. This setup typically involves a strong momentum candle followed by one or two "inside" bars, where the price range is contained within the range of the first candle. The third bar breaking the high or low of the inside bars signals a potential continuation of the initial momentum.
Integrating the POC into the 3 Bar setup adds a layer of volume-based confirmation. The placement of the POC relative to the three bars provides valuable context.
POC Placement in the 3 Bar Setup
Consider a bullish 3 Bar setup on a 1-hour chart:
- Bar 1 (Momentum Candle): A strong bullish candle. The POC for this bar indicates where the majority of volume occurred during this initial push.
- Bar 2 and 3 (Inside Bars): These bars have their highs below and lows above the range of Bar 1. The POC for these inside bars shows where volume was concentrated during the consolidation phase. Ideally, for a bullish continuation setup, the POC of the inside bars should be located in the upper portion of their range, indicating buying pressure even during the pause.
- Breakout: A subsequent candle breaking above the high of the inside bars confirms the potential continuation. The POC of the breakout candle, if also located towards the upper end, further strengthens the bullish signal.
Conversely, in a bearish 3 Bar setup, a strong bearish momentum candle is followed by inside bars. For a bearish continuation, the POC of the inside bars ideally would be in the lower portion of their range, suggesting selling pressure during the consolidation.
Trading the 3 Bar Setup with POC Confirmation
When trading the 3 Bar setup with POC, traders look for alignment between the price action pattern and the volume distribution indicated by the POC.
Entry and Exit Considerations
For a bullish 3 Bar setup with bullish POC placement in the inside bars, an entry might be considered on the break of the inside bar high. A stop loss could be placed below the low of the inside bars or below the POC of the inside bars for a tighter stop. For a bearish setup, an entry would be on the break of the inside bar low, with a stop loss above the inside bar high or above the inside bar POC.
Target levels can be determined using other technical analysis tools, such as previous swing highs/lows, Fibonacci extensions, or subsequent significant POC levels on the 1-hour chart or higher timeframes.
Here is a table summarizing the ideal POC placement for 3 Bar setups:
| Setup Type | Ideal POC Placement in Inside Bars | Indication |
|---|---|---|
| Bullish 3 Bar | Upper portion of inside bar range | Buying pressure during consolidation, favoring continuation |
| Bearish 3 Bar | Lower portion of inside bar range | Selling pressure during consolidation, favoring continuation |
It's important to remember that no single indicator or setup is foolproof. The 3 Bar setup with POC should be used in conjunction with other forms of analysis, such as overall market trend, support and resistance from higher timeframes (like the Value Area High (VAH) and Value Area Low (VAL) from the Volume Profile), and other confirming indicators.
Combining POC Wave and 3 Bar Setups
The power of these concepts is amplified when they are used together. Identifying a 3 Bar setup on a 1-hour chart that aligns with the direction indicated by the POC Wave can provide high-conviction trading opportunities.
Example Scenario
Imagine the POC Wave on a 1-hour chart has been steadily rising, indicating an uptrend. You then identify a bullish 3 Bar setup forming. If the POC within the inside bars of this setup is also located in the upper portion of their range, it provides strong confirmation that buyers are in control even during this brief pause. This confluence of a bullish POC Wave and a confirmed bullish 3 Bar setup presents a higher probability long trade opportunity.
Conversely, a falling POC Wave coupled with a bearish 3 Bar setup where the inside bar POC is in the lower portion would strengthen a potential short trade signal.
Additional Considerations for 1-Hour Chart Trading
Trading on the 1-hour chart offers a balance between the noise of lower timeframes and the slower signals of higher timeframes. It is a popular choice for day traders and swing traders. When using POC-based strategies on this timeframe, keep the following in mind:
-
Market Sessions: Volume and volatility can vary significantly depending on the market session. For Forex traders, the London and New York sessions typically have the highest volume, making POC analysis more relevant during these times.
-
Risk Management: Always employ proper risk management techniques. Define your stop-loss and take-profit levels before entering a trade. Risking no more than 1% of your capital per trade is a common guideline.
-
Backtesting and Practice: Before trading live with these strategies, thoroughly backtest them on historical data and practice on a demo account. This will help you understand how these setups perform in different market conditions and on the specific instruments you trade.
-
Confluence: Look for confluence with other technical analysis tools. This could include support and resistance levels, trendlines, moving averages, or other volume-based indicators. The more factors that align, the higher the probability of the trade.
-
Naked POCs: Pay particular attention to "naked POCs" on the 1-hour chart. These are POC levels that price has not returned to since they were formed. Naked POCs often act as strong magnets for future price action.
Frequently Asked Questions about POC Trading
What is the difference between POC and Value Area?
The Point of Control (POC) is the single price level within a Volume Profile with the highest traded volume. The Value Area (VA) is a range of prices within the Volume Profile where a specified percentage of the total volume for the period occurred (commonly 70%). While the POC is the most active price level, the Value Area represents the range where the majority of trading activity took place and is considered by market participants to be the "fair value" area.
Can POC be used for scalping?
Yes, POC can be used for scalping, particularly on lower timeframes. Identifying POCs on short timeframes (like 1-minute or 5-minute charts) can help scalpers pinpoint high-liquidity areas for quick entries and exits. However, the signals on lower timeframes can be noisier, requiring precise execution and tight risk management.
How often does the POC change?
The frequency at which the POC changes depends on the timeframe being analyzed. On a 1-hour chart, a new POC is calculated for each 1-hour period (or a specified aggregation of 1-hour periods depending on the Volume Profile settings). The "Developing POC" shows how the POC shifts within the current, unfinished period as volume accumulates.
Is POC a leading or lagging indicator?
The POC, as part of the Volume Profile, is generally considered a reactive or lagging indicator. It reflects where volume has already been traded. However, by identifying areas of high volume concentration, the POC can provide insights into potential future support and resistance levels, giving it a predictive quality in that sense.
References
Last updated April 21, 2025