
Unlocking Dynamic Insights: Building Interactive Dashboards with Power BI and SQL Server
Seamlessly integrating robust data management with powerful visualization for actionable intelligence.
Key Highlights for Interactive Dashboards:
- Direct Connectivity: Power BI offers straightforward methods to connect with SQL Server, allowing for both import and DirectQuery modes to suit various data freshness requirements.
- Data Transformation Power: Leverage SQL Server for initial data cleaning and preparation, then utilize Power Query Editor in Power BI for further transformation and modeling, ensuring your data is primed for visualization.
- Interactive Elements: Enhance user engagement by incorporating Power BI's interactive features such as slicers, filters, drill-downs, and dynamic calculations (DAX), enabling users to explore data at multiple levels of granularity.
In today's data-driven world, the ability to transform raw data into actionable insights is paramount for businesses. Microsoft Power BI, a powerful business intelligence tool, excels at creating rich, interactive reports and dashboards. When combined with SQL Server, a robust relational database management system, the synergy allows organizations to manage vast amounts of data efficiently and visualize it compellingly. This comprehensive guide will walk you through the process of building interactive dashboards using Power BI and SQL Server data, from initial connection to advanced visualization techniques.
The Synergy of Power BI and SQL Server
Power BI and SQL Server are both integral parts of Microsoft's data ecosystem, designed to work together seamlessly. SQL Server provides a secure and reliable foundation for storing and managing your organizational data, while Power BI offers the visualization capabilities to transform that data into meaningful dashboards. This combination allows for real-time monitoring of business metrics, comprehensive analysis of trends, and the ability to make data-driven decisions swiftly.
The strength of this integration lies in Power BI's ability to connect directly to SQL Server databases, whether on-premises or in the cloud. This direct connection ensures that your dashboards can display the most up-to-date information, making them invaluable tools for operational intelligence and strategic planning.
Why Choose Power BI with SQL Server Data?
Businesses often choose this combination for several compelling reasons:
- Centralized Data Management: SQL Server centralizes your data, making it easier to manage, secure, and update. This ensures data integrity and consistency across all reports.
- Real-Time Insights: With DirectQuery connectivity, Power BI dashboards can display live data from SQL Server, providing immediate insights into evolving business conditions.
- Scalability: Both Power BI and SQL Server are highly scalable, capable of handling small datasets for individual projects or massive enterprise-level data warehouses.
- Powerful Transformation: SQL can be used for initial data cleaning and structuring, while Power BI's Power Query Editor allows for further sophisticated transformations and data modeling.
- Interactive Experience: Power BI's intuitive interface and rich visualization options enable the creation of highly interactive dashboards that users can explore and analyze independently.
Connecting Power BI to SQL Server
The first crucial step in building interactive dashboards is establishing a robust connection between Power BI and your SQL Server database. Power BI Desktop provides a straightforward process for this, supporting various authentication methods and data connectivity modes.
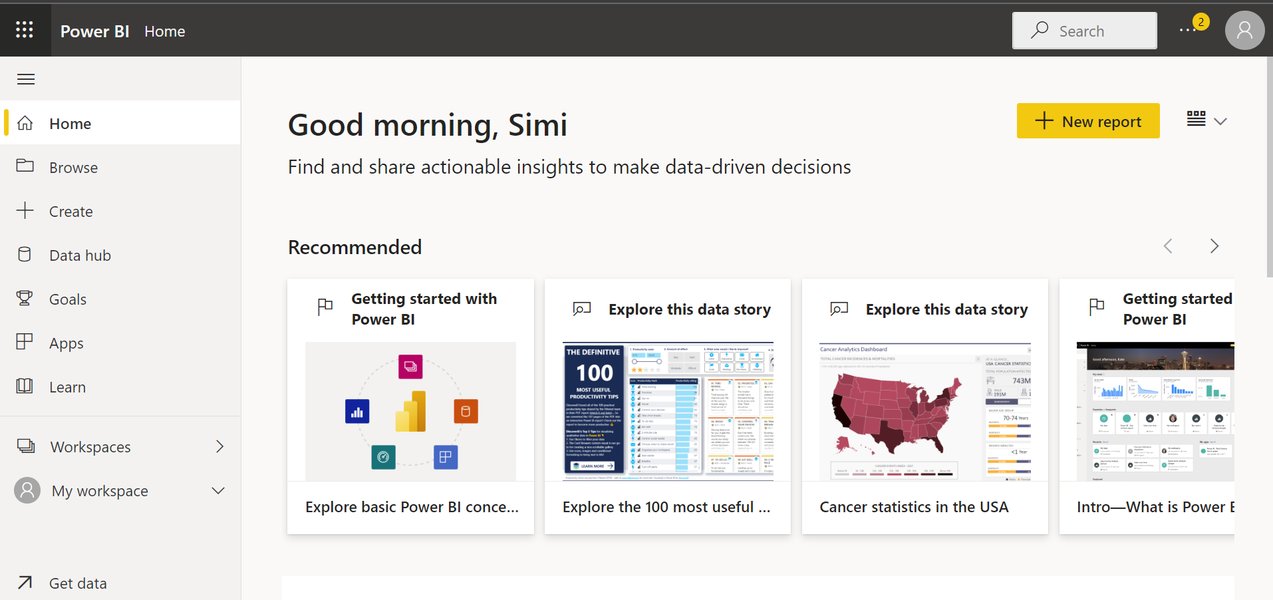
An example of a Power BI dashboard interface.
Step-by-Step Connection Guide
Connecting Power BI to SQL Server is a fundamental process. Here's how to do it:
- Open Power BI Desktop: Launch the Power BI Desktop application on your local machine.
- Get Data: On the Home tab, select "Get data". From the dropdown, choose "SQL Server database".
- Enter Server and Database Details: In the SQL Server database dialog box, enter the name of your SQL Server instance. You can optionally specify a database name.
- Choose Data Connectivity Mode:
- Import: This mode imports a snapshot of the data into Power BI's cache. It offers faster performance for interactivity but requires scheduled refreshes to keep data up-to-date.
- DirectQuery: This mode connects directly to the SQL Server database, running queries against the source database each time the dashboard is interacted with. It ensures real-time data but can be slower for complex queries or large datasets.
- Authentication: Select your preferred authentication method (e.g., Windows authentication, Database authentication). If using Database authentication, provide your credentials.
- Navigate and Load: After successful connection, the Navigator window will appear, listing tables and views from your database. Select the tables you wish to use and click "Load" to bring the data into Power BI, or "Transform Data" to open Power Query Editor for pre-loading transformations.
For on-premises SQL Server databases, an on-premises data gateway is required for Power BI Service to connect and refresh data. This gateway acts as a secure bridge between Power BI's cloud services and your local data sources.
Advanced Connection Options
When connecting, you might encounter advanced options such as:
- Command timeout in minutes: Adjusts how long Power BI waits for a query to execute in SQL Server before timing out. Useful for large queries.
- SQL statement: Allows you to write a custom SQL query to extract specific data directly from SQL Server, giving you more control over the data loaded into Power BI. This is particularly useful for cleaning data and building out specific tables externally before importing.
- Navigate using full hierarchy: Displays the complete hierarchy of tables, including those without data, which can be helpful for understanding the database schema.
Data Preparation and Modeling
Once connected, the next critical phase involves preparing and modeling your data within Power BI. This often involves cleaning, transforming, and establishing relationships between tables to ensure your data is optimized for accurate and insightful visualizations.
Leveraging Power Query Editor
Power Query Editor is Power BI's built-in data transformation tool. It allows you to shape and refine your data before it's loaded into the Power BI data model. Common transformations include:
- Removing unwanted columns or rows.
- Changing data types.
- Merging or appending queries.
- Pivoting and unpivoting columns.
- Handling missing values.
While SQL can be used to pre-clean data and build necessary tables directly in the database, Power Query offers additional flexibility for business users to perform transformations without direct SQL expertise.
Building a Robust Data Model
A well-structured data model is the backbone of any effective Power BI dashboard. It involves:
- Establishing Relationships: Define relationships between your tables (e.g., one-to-many, many-to-many) based on common columns. This enables seamless filtering and analysis across different datasets.
- Creating Calculated Columns and Measures (DAX): Data Analysis Expressions (DAX) is Power BI's formula language. It's used to create new calculations that aren't directly available in your source data. Measures are used for aggregations (like sum of sales), while calculated columns add new columns to your tables based on existing data. DAX is crucial for enabling dynamic user inputs and advanced analytical capabilities.
- Optimizing Performance: Ensure your data model is efficient by minimizing data redundancy, using appropriate data types, and optimizing DAX calculations.
Designing Interactive Power BI Dashboards
Power BI dashboards are single-page canvases that tell a story through visualizations. They are designed to provide a consolidated view of key metrics and are highly interactive, allowing users to explore data at various levels of detail.
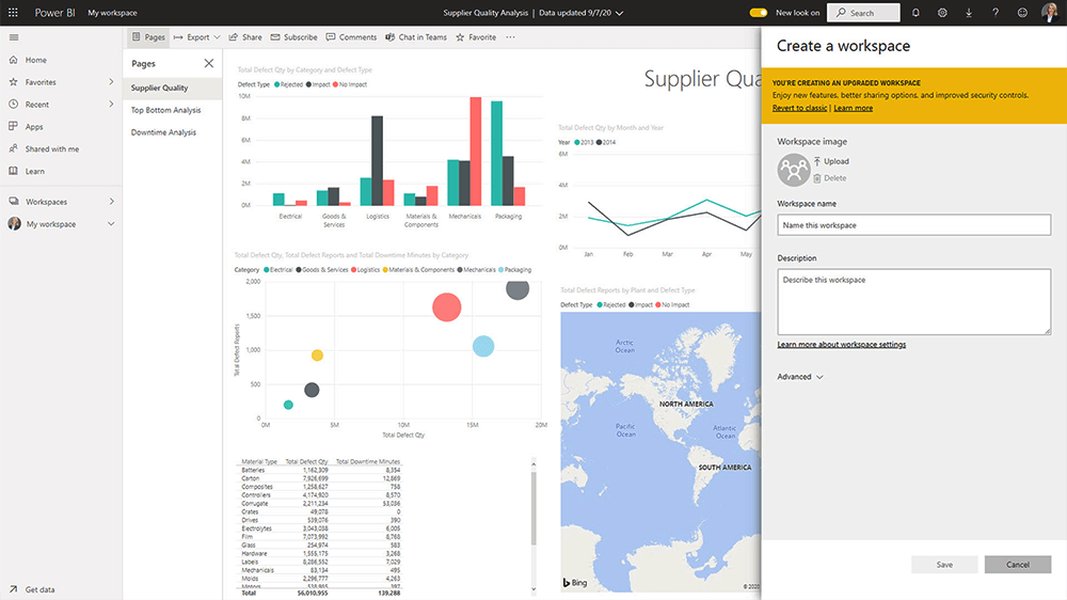
An illustration of Power BI Service Workspaces, where dashboards are often managed and shared.
Key Interactive Features
To make your dashboards truly interactive and user-friendly, incorporate the following Power BI features:
- Slicers: Slicers act as on-report filters, allowing users to quickly segment data by selecting specific values (e.g., filtering sales by region, date range).
- Filters: Beyond slicers, you can apply page-level, report-level, and visual-level filters to control what data is displayed.
- Drill-Down and Drill-Through:
- Drill-down: Allows users to explore hierarchical data (e.g., from year to quarter to month).
- Drill-through: Enables users to jump from a summary visual on one page to a more detailed page, with the context filtered by the selected data point.
- Bookmarks: Save specific views of your report, including filters and slicer selections, allowing users to quickly return to predefined states.
- Buttons and Page Navigators: Create intuitive navigation paths between different report pages, making it easier for users to find the information they need.
- Tooltips: Customize tooltips to display additional details when a user hovers over a data point, enriching the visual context.
Visualization Best Practices
Effective dashboard design goes beyond just adding visuals. Consider these best practices:
- Clarity and Simplicity: Avoid visual clutter. A well-designed dashboard contains only the highlights and essential information.
- Strategic Layout: Arrange visuals logically. Use cards for key performance indicators (KPIs), charts for trends, and tables for detailed data.
- Consistent Branding: Use consistent colors, fonts, and themes to create a professional and cohesive look.
- Mobile Optimization: Design for mobile viewing, as users often access dashboards on various devices.
- User Experience (UX): Think like your end-users. How can you make the dashboard intuitive and easy to navigate?
Implementing Real-Time Dashboards
For scenarios requiring up-to-the-minute data, Power BI offers capabilities to create live dashboards from SQL Server data. This is particularly valuable for operational monitoring where timely insights are critical.
Scheduled Refresh vs. DirectQuery
The choice between scheduled refresh and DirectQuery depends on your data freshness requirements and performance considerations:
- Scheduled Refresh (Import Mode): Data is periodically imported into Power BI. This is suitable for data that doesn't change constantly or where slight latency is acceptable. You configure a refresh schedule in the Power BI Service.
- DirectQuery: This mode establishes a live connection, and Power BI queries the SQL Server database directly every time a visual is interacted with or refreshed. This ensures real-time data but can be slower due to direct database calls.
On-premises Data Gateway Configuration
To enable scheduled refresh or DirectQuery for on-premises SQL Server data, an on-premises data gateway must be installed and configured. This gateway acts as a secure bridge, allowing Power BI Service (the cloud-based platform) to connect to your local SQL Server database. You'll add your SQL Server database as a data source to the gateway and define authentication methods.
Illustrative Scenario: Sales Performance Dashboard
Let's consider a scenario where you want to build an interactive sales performance dashboard. You have sales data stored in a SQL Server database, including details like sales amount, product category, region, and date.
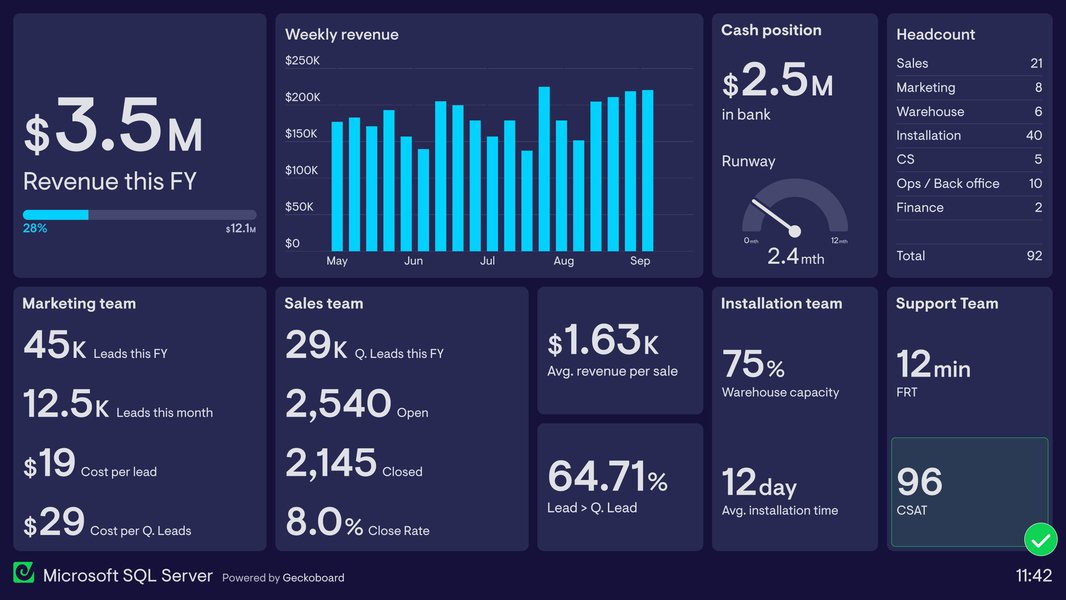
An example of a SQL-driven sales dashboard.
Dashboard Components
A sales performance dashboard could include:
- KPI Cards: Display total sales, sales growth, average order value.
- Sales by Region Chart: A bar chart showing sales performance across different geographical regions.
- Sales by Product Category: A pie chart or treemap illustrating sales distribution by product category.
- Sales Trend Line Chart: A line chart showing sales over time, allowing for drill-down to specific months or quarters.
- Slicers: Add slicers for "Region", "Product Category", and "Date Range" to allow users to dynamically filter the data.
The Analytical Power of Interactive Dashboards
Interactive dashboards empower users to delve deeper into data, identifying trends, outliers, and patterns that might otherwise be hidden. For instance, by using a region slicer, a sales manager can quickly see how sales in North America compare to Europe. With a drill-down feature on the sales trend chart, they can analyze monthly sales within a specific quarter, pinpointing peak performance periods or areas needing attention. This self-service analytics capability significantly enhances decision-making across the organization.
This radar chart illustrates the perceived strengths of Power BI and SQL Server in different aspects of data management and visualization, highlighting their complementary nature.
Considerations for Optimal Performance and Design
While Power BI and SQL Server offer immense capabilities, optimizing their integration is key to achieving the best performance and user experience.
Pre-Processing Data in SQL Server
It is often beneficial to perform as much data cleaning, transformation, and aggregation as possible directly within SQL Server using SQL queries or views. This offloads processing from Power BI, leading to faster report loading and improved dashboard performance. For example, creating views that combine data from multiple tables or pre-calculating complex metrics can significantly streamline the data flow into Power BI.
Here's a simplified SQL example of a view that could be created in SQL Server:
CREATE VIEW SalesSummary AS
SELECT
    p.ProductName,
    c.CategoryName,
    SUM(s.SalesAmount) AS TotalSales,
    YEAR(s.OrderDate) AS SalesYear
FROM
    Sales.FactSales s
JOIN
    Production.DimProduct p ON s.ProductID = p.ProductID
JOIN
    Production.DimCategory c ON p.CategoryID = c.CategoryID
GROUP BY
    p.ProductName,
    c.CategoryName,
    YEAR(s.OrderDate);
This view, SalesSummary, pre-aggregates sales data, which can then be directly imported or queried by Power BI, reducing the computational load on Power BI Desktop or Service.
Designing for User Engagement
An interactive dashboard is only effective if users engage with it. Considerations for user engagement include:
- Intuitive Navigation: Use clear labels, consistent layouts, and logical flow between pages.
- Actionable Insights: Ensure that the visualizations provide meaningful insights that lead to informed decisions.
- Performance: Slow dashboards can deter users. Optimize data models and queries to ensure quick loading times.
- Feedback Mechanisms: Gather user feedback to continuously improve the dashboard's usability and relevance.
Common Challenges and Solutions
While powerful, integrating Power BI with SQL Server can present certain challenges.
Data Freshness vs. Performance
The trade-off between real-time data (DirectQuery) and performance (Import mode) is a frequent dilemma. For highly volatile data where immediate updates are crucial, DirectQuery is preferred, but it necessitates a well-optimized SQL Server database and efficient queries. For less frequently updated data or historical analysis, Import mode with scheduled refreshes offers superior performance. A hybrid approach, using DirectQuery for critical, fast-changing KPIs and Import mode for less dynamic data, can also be considered.
Credential Management and Security
Securing data connections is paramount. When connecting Power BI to SQL Server, ensure appropriate authentication methods are used, and credentials are managed securely, especially with on-premises data gateways. Implementing row-level security (RLS) in Power BI can further restrict data access based on user roles, ensuring that users only see the data they are authorized to view.
Complexity of DAX and Power Query
While powerful, DAX and Power Query can have a learning curve. Complex transformations or calculations might require advanced skills. Investing in training or leveraging pre-built SQL views can mitigate this challenge.
Here's a table summarizing the characteristics of Power BI and SQL Server integration:
| Feature | SQL Server Role | Power BI Role | Synergy/Benefit |
|---|---|---|---|
| Data Storage | Primary data repository, robust RDBMS | In-memory storage (Import mode), direct query conduit | SQL provides secure, scalable storage; Power BI accesses for analysis. |
| Data Transformation | Initial cleaning, complex queries, views, stored procedures | Power Query Editor for shaping, combining, and refining data | Pre-processing in SQL optimizes performance; Power BI refines for visuals. |
| Data Modeling | Defines database schema, relationships, integrity constraints | Establishes relationships between imported/queried tables, DAX for calculations | SQL provides relational foundation; Power BI enhances for analytical models. |
| Real-Time Capabilities | Live data source for DirectQuery | DirectQuery mode for live dashboards, scheduled refresh for near real-time | Monitor KPIs with up-to-the-minute data. |
| Visualization | Raw data provider | Creates interactive charts, graphs, tables, and dashboards | Transforms raw SQL data into compelling visual stories. |
| Interactivity | Underlying data engine responding to queries | Slicers, filters, drill-downs, drill-throughs, dynamic user inputs | Empowers users to explore data dynamically. |
| Security | Database-level security, user permissions | Row-Level Security (RLS), workspace permissions, data gateway security | Comprehensive data access control from source to dashboard. |
| Scalability | Scalable database architecture for large datasets | Handles large datasets, scalable cloud service for sharing | Supports growing data volumes and user bases. |
Video Deep Dive: Connecting Power BI to SQL Server
For a practical demonstration of connecting Power BI to a SQL Server database, the following video provides a step-by-step walkthrough. It covers the essential process of getting your data from SQL Server into Power BI, which is the foundation for any interactive dashboard. This visual guide can be particularly helpful for new users to grasp the initial setup and data import procedures.
A tutorial demonstrating how to connect SQL Server data to Power BI.
This video titled "How to connect SQL Server in Power BI" is highly relevant as it addresses the foundational step for anyone looking to build interactive dashboards using these two powerful tools. It simplifies the process of importing SQL Server data into Power BI, which is the prerequisite for all subsequent data modeling and visualization efforts. Understanding this connection mechanism is crucial for ensuring that your Power BI dashboards can access and display the necessary data efficiently and accurately.
Frequently Asked Questions (FAQ)
Conclusion
Building interactive dashboards with Power BI and SQL Server data is a powerful approach to transforming raw data into actionable insights. The seamless integration between SQL Server's robust data management capabilities and Power BI's intuitive visualization features empowers organizations to monitor performance, identify trends, and make informed decisions with confidence. By following best practices in data connection, preparation, modeling, and dashboard design, businesses can create dynamic, user-friendly dashboards that truly drive value and foster a data-driven culture.
Recommended Further Exploration
- Explore advanced data modeling techniques in Power BI.
- Learn how to optimize SQL queries for better Power BI performance.
- Discover how to implement row-level security for secure data access in Power BI.
- Understand principles for designing highly user-friendly Power BI dashboards.
Referenced Search Results
 denglishbi.wordpress.com