
Unlocking Data Potential: Building Interactive Dashboards with Power BI and SQL Server
Seamlessly integrating robust data management with dynamic visualization for actionable insights.
Key Insights into Power BI and SQL Server Integration
- Direct Connectivity and Data Transformation: Power BI offers straightforward methods to connect to SQL Server databases, allowing for direct data import or DirectQuery modes. This integration is crucial for bringing structured SQL data into Power BI's powerful data modeling and transformation engine (Power Query) for cleaning and shaping before visualization.
- Enhanced Interactivity and Real-time Insights: Interactive dashboards in Power BI, powered by SQL Server data, enable users to explore data dynamically through features like slicers, filters, drill-down, and drill-through capabilities. This interactivity is essential for identifying trends, patterns, and anomalies, leading to real-time, actionable insights for decision-making.
- Data Governance and Security with On-premises Gateways: For on-premises SQL Server databases, Power BI utilizes data gateways to ensure secure and reliable connectivity, enabling scheduled data refreshes and maintaining data integrity. This setup is vital for businesses requiring secure access to their internal data while leveraging Power BI's cloud-based analytics capabilities.
The Synergy of Power BI and SQL Server for Interactive Dashboards
The combination of Microsoft Power BI and SQL Server creates a powerful ecosystem for data analysis and visualization, especially for building interactive dashboards. SQL Server acts as a robust, centralized repository for structured data, offering reliability, security, and integrity. Power BI, on the other hand, is a self-service analytics tool that excels at transforming raw data into engaging, interactive visualizations and reports, enabling users to gain instant, actionable insights. This synergy allows organizations to centralize and streamline their data analysis workflows, leading to more informed and proactive decision-making.
Connecting Power BI to SQL Server enables users to securely access and view live dashboards and reports on various devices. This integration is particularly beneficial for businesses that need to track key operating metrics, monitor stock levels, analyze sales trends, and manage supply chain logistics in real-time. By leveraging SQL Server for data management and Power BI for visualization, companies can achieve a holistic view of their data, empowering teams with real-time insights.
Connecting Power BI to SQL Server: A Step-by-Step Approach
Establishing a connection between Power BI and SQL Server is a fundamental first step in building powerful interactive dashboards. This process can be executed through Power BI Desktop, allowing for various data connectivity modes and advanced options for data manipulation.
Initial Setup and Data Source Selection
Before connecting, ensure you have Power BI Desktop installed. The process begins by selecting the "Get Data" option within Power BI. From the available connectors, choose "SQL Server database." This option allows you to specify the server name and, optionally, the database name you wish to connect to. It's crucial to have the necessary credentials to access the SQL Server, whether it's through Windows authentication or SQL authentication.
An example of the Power BI dashboard interface.
Choosing Data Connectivity Modes
Power BI Desktop offers two primary data connectivity modes when connecting to SQL Server: Import and DirectQuery.
- Import Mode: This mode imports a snapshot of the data from SQL Server into Power BI's in-memory engine. It offers fast performance for visualizations as all queries are executed against the imported data. However, data freshness depends on scheduled refreshes.
- DirectQuery Mode: In contrast, DirectQuery doesn't import data. Instead, it directly queries the SQL Server database every time a visualization or report is interacted with. This mode is ideal for real-time reporting where data freshness is critical, but it can be slower due to live queries on the source database.
Advanced Options for Connectivity
When connecting, Power BI also provides "Advanced options" that can be critical for optimizing your data import or query. These options include specifying a command timeout in minutes, enabling SQL Server Failover support, and defining a SQL statement to retrieve specific data. Using a SQL statement directly allows for pre-cleaning and shaping data at the source, which can significantly improve performance and efficiency within Power BI. For instance, you can use SQL to clean data and build out tables externally before importing them into Power BI.
Data Transformation and Modeling in Power BI
Once connected, the Power Query Editor in Power BI Desktop becomes your primary tool for data transformation. This is where you can clean, reshape, and combine data from SQL Server and other sources to prepare it for analysis. Common transformations include removing irrelevant columns, handling missing values, changing data types, and merging or appending tables. The goal is to create a clean, optimized data model that supports efficient report generation.
Building a robust data model is crucial. This involves defining relationships between tables, creating calculated columns and measures using Data Analysis Expressions (DAX), and ensuring data integrity. A well-structured data model is the foundation for creating interactive and insightful dashboards.
Designing Interactive Dashboards in Power BI
Dashboards in Power BI are single-page canvases that tell a story through visualizations. Unlike multi-page reports, dashboards are designed to provide a high-level overview, often composed of visuals pinned from various reports and even different semantic models. The interactivity of these dashboards is a key differentiator, allowing users to drill down, filter, and slice data to explore insights at different levels of granularity.
Elements of an Interactive Dashboard
- Visualizations: Power BI offers a wide array of visualization types, including bar charts, pie charts, line graphs, maps, and custom visuals. Selecting the right visualization is crucial for effectively conveying insights and allowing users to easily spot trends, outliers, and anomalies.
- Slicers and Filters: These are fundamental to interactivity, allowing users to filter data dynamically. Slicers appear directly on the dashboard canvas, providing intuitive options for users to interact with the data. Filters, on the other hand, can be applied to specific visuals, pages, or the entire report.
- Drill-Down and Drill-Through: These features enable deeper data exploration. Drill-down allows users to navigate from a summary level to more detailed data within a single visual hierarchy. Drill-through allows users to jump from one report page to another, passing filter contexts to analyze related data in detail.
- Dynamic Interactions: Configuring interactions between visuals means that selecting a data point in one visual can automatically filter or highlight related data in other visuals on the dashboard, enhancing the exploratory experience.
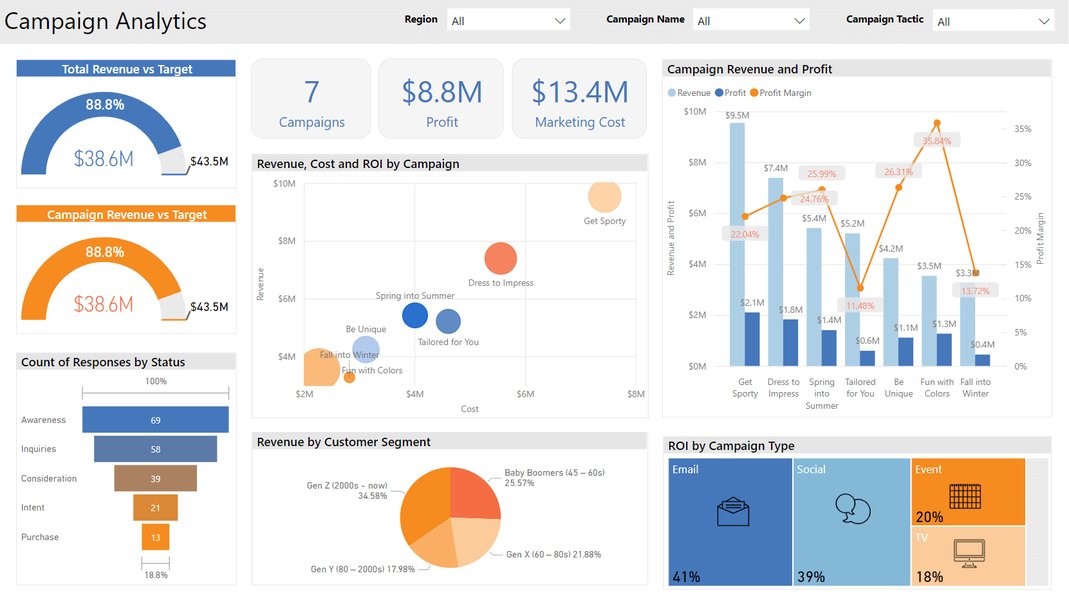
An example of a marketing campaign analytics dashboard created in Power BI.
Real-time Dashboards and Data Refresh
For scenarios requiring real-time or near real-time data, Power BI integrates with SQL Server through on-premises data gateways. The data gateway acts as a bridge, ensuring secure communication between Power BI and your local SQL Server database. This is essential for scheduled refreshes or DirectQuery connections, allowing your dashboards to display the most current data.
Configuring a refresh schedule ensures that your Power BI semantic model always has recent data, making your dashboards truly dynamic and responsive to changes in the underlying SQL Server database. This capability is vital for operational dashboards that monitor key performance indicators (KPIs) and business processes live.
Advantages of Combining Power BI with SQL Server
The integration of Power BI and SQL Server offers numerous benefits for data analysis and business intelligence.
| Feature/Benefit | Description | Impact on Interactive Dashboards | |||
|---|---|---|---|---|---|
| Robust Data Storage | SQL Server provides a highly reliable, secure, and scalable environment for storing large volumes of structured data. | Ensures a stable and trustworthy data source for consistent dashboard performance and accuracy. | |||
| Advanced Data Preparation | SQL allows for powerful data cleaning, transformation, and aggregation directly at the source using T-SQL queries before data is ingested into Power BI. | Reduces load on Power BI's data model, improves query performance, and allows for more complex data pre-processing. | |||
| Real-time Insights | Through DirectQuery and scheduled refreshes via data gateways, Power BI can display live or near real-time data from SQL Server. | Provides immediate insights into current business operations, enabling timely decision-making. | |||
| Interactive Visualization | Power BI's intuitive interface and rich set of visualizations (slicers, filters, drill-downs) enable users to dynamically explore data. | Enhances user engagement and allows for self-service discovery of trends, patterns, and anomalies. | |||
| Data Governance and Security | SQL Server's robust security features, combined with Power BI's row-level security and data gateways, ensure data access is controlled and secure. | Protects sensitive information while providing necessary data access to authorized users for reporting. | |||
| Scalability and Performance | The combined strength allows for handling large datasets effectively. SQL Server manages the backend, while Power BI optimizes front-end visualization. | Supports growing data volumes and complex analytical needs without compromising dashboard responsiveness. | Centralized Data Management | Centralizing data in SQL Server makes it easier to manage, keep up-to-date, and integrate into various Power BI reports. | Simplifies data maintenance and ensures consistency across all dashboards and reports leveraging the same source. |
Key Considerations for Successful Implementation
While the combination of Power BI and SQL Server offers significant advantages, successful implementation requires careful planning and execution.
Optimizing SQL Queries for Power BI
Performance is paramount. When pulling data from SQL Server, especially with DirectQuery, optimizing your SQL queries is critical. Complex queries, large joins, or unindexed tables can significantly slow down your Power BI dashboards. Utilizing stored procedures or creating optimized views in SQL Server can pre-process data efficiently, making it faster for Power BI to consume. This shifts the computational burden to the database server, where it can often be handled more effectively.
Best Practices for SQL Query Optimization:
- Select Only Necessary Columns: Avoid
SELECT *. Only retrieve the columns required for your Power BI report. - Filter Data at the Source: Apply
WHEREclauses in your SQL query to filter data before it reaches Power BI. This reduces the volume of data transferred and processed. - Aggregate Data Where Possible: If your dashboard only requires aggregated data (e.g., total sales per month), perform the aggregation using
GROUP BYclauses in SQL. - Use Appropriate Indexes: Ensure that tables involved in joins and filtering conditions have appropriate indexes in SQL Server to speed up query execution.
Designing for User Experience and Performance
An interactive dashboard should not only be informative but also intuitive and fast. Design choices in Power BI directly impact user experience and performance.
Dashboard Design Principles:
- Clarity and Simplicity: Avoid visual clutter. Focus on key metrics and insights. Too many visuals or pages can overwhelm users and degrade performance.
- Strategic Use of Slicers and Filters: Place slicers prominently and organize them logically. Use collapsible slicer panels to maximize canvas space.
- Optimize Visuals: Choose visuals that are most effective for the data you are presenting. Complex visuals with many data points can be slower to render.
- Minimize Data Model Complexity: While DAX is powerful, overly complex measures or calculated columns can impact performance. Optimize your data model by pre-calculating values in SQL where feasible.
Understanding Dashboard Interaction Capabilities
To further illustrate the interactive capabilities that Power BI dashboards offer when connected to SQL Server, let's consider a radar chart that evaluates various aspects of a dashboard's interactivity and user-friendliness.
This radar chart illustrates the strengths of interactive dashboards created using Power BI and SQL Server. Each axis represents a crucial aspect of dashboard effectiveness: Data Freshness (how up-to-date the data is), User Interactivity (ease of filtering, slicing, and drilling), Performance Optimization (speed of loading and responsiveness), Data Security (protection of sensitive information), and Scalability (ability to handle growing data volumes). Higher values indicate stronger capabilities in that area. Power BI's DirectQuery and scheduled refresh capabilities, backed by SQL Server, ensure high Data Freshness. The intuitive Power BI interface coupled with features like slicers and drill-downs boosts User Interactivity. Performance Optimization relies heavily on well-structured SQL queries and efficient data models. Data Security is maintained through SQL Server's robust security features and Power BI's data gateway. Lastly, Scalability is achieved by leveraging SQL Server's capacity for large datasets and Power BI's ability to handle complex data models.
Creating a Real-Time Dashboard in Power BI with SQL Server Data
Building a real-time dashboard is a common and impactful use case for Power BI and SQL Server. This process involves ensuring continuous data flow from the SQL database to your Power BI reports.
The Role of the On-Premises Data Gateway
When your SQL Server database is on-premises, a Power BI On-premises Data Gateway is essential for facilitating secure and efficient communication between Power BI Service and your SQL Server. This gateway allows for scheduled data refreshes and DirectQuery connections, ensuring that your dashboard data is always current without exposing your database directly to the internet.
This video demonstrates how to create a real-time dashboard in Power BI using SQL Server data, covering the essential steps from data connection to visualization for dynamic, up-to-date reporting.
The video above provides a comprehensive demonstration of creating a real-time SQL Server dashboard in Power BI. It highlights the critical steps involved in setting up the connection, configuring data refreshes, and designing visualizations that reflect immediate changes in the underlying SQL database. This is particularly useful for operational dashboards where timely insights into performance, inventory, or sales are crucial for quick decision-making.
Configuring Scheduled Refresh
For data that doesn't need to be live but requires regular updates, setting up a scheduled refresh in the Power BI Service is the way to go. After publishing your report from Power BI Desktop to the Power BI Service, you configure the dataset's settings to use the installed data gateway and define the refresh frequency (e.g., daily, hourly). This automates the process of fetching the latest data from SQL Server into your Power BI reports.
-- Example SQL Query for a scheduled refreshable dataset
-- This query fetches sales data for the last 24 hours
SELECT
    SaleID,
    ProductID,
    Quantity,
    SaleDate,
    Revenue
FROM
    Sales.DailySales
WHERE
    SaleDate >= DATEADD(hour, -24, GETDATE());
This SQL query exemplifies a common scenario for a scheduled refresh, fetching only the most recent data to keep the Power BI report updated efficiently. By limiting the data pulled to only what's necessary, performance is improved, and data transfer costs are minimized.
Frequently Asked Questions
Conclusion
Building interactive dashboards with Power BI and SQL Server data is a transformative capability for any organization seeking to harness the full potential of its data. SQL Server provides the robust, secure, and scalable foundation for data storage and initial processing, while Power BI offers an intuitive and powerful platform for transforming that data into dynamic, actionable insights. By establishing secure connections, optimizing data queries, and thoughtfully designing interactive visualizations, businesses can create dashboards that not only display information but also empower users to explore, analyze, and make data-driven decisions in real-time. This synergy between database management and business intelligence tools is crucial for staying competitive in today's data-intensive world.
Recommended Further Exploration
- Optimizing SQL Server queries for Power BI performance
- Advanced data modeling techniques in Power BI
- Implementing row-level security in Power BI with SQL Server
- Power BI data gateway configuration for real-time dashboards
Referenced Search Results
 denglishbi.wordpress.com
denglishbi.wordpress.com
denglishbi.wordpress.com