
Understanding Price Action in Financial Markets
A Comprehensive Guide to Decoding Market Movements
Key Takeaways
- Foundation of Technical Analysis: Price action is the cornerstone of technical trading, focusing solely on price movements to make informed decisions.
- Versatile Trading Tool: Applicable across various markets and timeframes, price action offers flexibility and real-time analysis.
- Patterns and Trends: Recognizing and interpreting price patterns and trends is essential for predicting future market behavior.
Introduction to Price Action
Price action is a fundamental method used in technical analysis and trading that focuses on the movement of an asset's price over time. Unlike other trading strategies that rely heavily on technical indicators or fundamental data, price action trading emphasizes the analysis of raw price movements as depicted on various types of charts. This approach is considered the purest form of technical analysis, as it directly reflects the collective actions and psychology of market participants without the interference of additional data layers.
Core Concepts of Price Action Trading
1. Price Charts
Traders utilize different types of price charts to visualize and interpret price movements. The most common chart types include:
- Candlestick Charts: Provide detailed information about the price action within a specific time frame, including open, high, low, and close prices.
- Bar Charts: Similar to candlestick charts but represented differently, showing the price range for a specific period.
- Line Charts: Simplistic representation that connects closing prices over a set period, offering a clear view of overall trends.
2. Trends
Identifying market trends is crucial in price action trading. Trends can be categorized as:
- Uptrend: Characterized by higher highs and higher lows, indicating a consistent price increase.
- Downtrend: Defined by lower highs and lower lows, signaling a continuous price decrease.
- Sideways/Horizontal Trend: Occurs when the price oscillates within a range without a clear upward or downward movement.
3. Support and Resistance
Support and resistance levels are pivotal in understanding potential price movements:
- Support: A price level where buying interest is strong enough to prevent the price from declining further.
- Resistance: A price level where selling pressure is sufficient to halt price increases.
These levels act as psychological barriers and are often key decision points for traders in determining entry and exit strategies.
4. Price Patterns
Recognizing specific price patterns is essential for predicting future market behavior. Common patterns include:
- Triangles: Indicative of periods of consolidation before a breakout, either bullish or bearish.
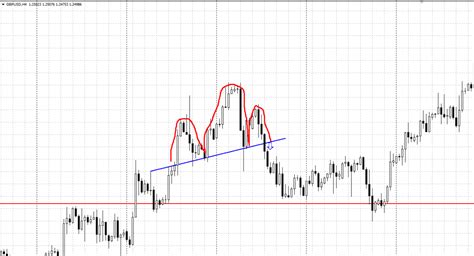
- Head and Shoulders: A reversal pattern signaling the end of an uptrend and the potential start of a downtrend.
- Double Tops and Bottoms: Patterns that indicate potential reversals after two failed attempts to break a support or resistance level.
- Pin Bars: Candlestick patterns that indicate potential reversals through their distinctive long wicks.
5. Candlestick Patterns
Candlestick patterns provide insights into market sentiment and potential reversals:
- Doji: Indicates indecision in the market, often leading to reversals.
- Engulfing Patterns: Suggest a strong reversal signal when a small candlestick is followed by a larger one that completely engulfs it.
- Hammer and Shooting Star: Signal potential reversals based on their unique formations.
6. Volume Consideration
While price action primarily focuses on price movements, some traders incorporate volume analysis to validate the strength of trends or breakouts. High volume during a price movement can indicate the reliability of the trend, while low volume may suggest a lack of conviction.
Advantages of Price Action Trading
- Simplicity: Eliminates the need for complex indicators, allowing traders to focus solely on price movements.
- Flexibility: Applicable across various markets, including stocks, forex, and commodities, and adaptable to different timeframes.
- Real-Time Analysis: Reflects the most current market conditions, enabling timely trading decisions based on actual price movements.
- Enhanced Market Understanding: Develops a deep comprehension of market dynamics and participant behavior through price movements.
Challenges of Price Action Trading
- Subjectivity: Interpretations of price movements can vary between traders, leading to potential inconsistencies.
- Steep Learning Curve: Requires extensive practice and experience to accurately recognize and interpret patterns and trends.
- Market Conditions: Effectiveness can diminish in highly volatile or choppy markets where clear patterns are hard to identify.
Common Trading Strategies Using Price Action
1. Trend Following
This strategy involves entering trades in the direction of the prevailing trend. Traders identify the trend using trendlines and momentum indicators, then look for patterns like higher highs in an uptrend or lower lows in a downtrend to confirm entry points.
2. Breakouts
Traders aim to enter the market when the price breaks above a resistance level or below a support level. A breakout signifies a potential continuation of the current trend, providing opportunities for significant gains.
3. Reversal Trading
This strategy focuses on identifying potential reversal points in the market. By recognizing candlestick patterns like hammers or shooting stars, traders can anticipate a change in the current trend and enter positions accordingly.
4. Range Trading
In markets exhibiting sideways movement, traders exploit the oscillations between defined support and resistance levels. The strategy involves buying near support and selling near resistance, capitalizing on the price's tendency to revert to the mean.
5. Pin Bar Trading
Pin bars are distinctive candlestick patterns with a long wick and small body, indicating a rejection of higher or lower prices. Traders use pin bars to identify potential reversals and enter the market in the opposite direction of the tail.
Risk Management in Price Action Trading
Effective risk management is crucial for long-term success in price action trading. Key aspects include:
- Stop-Loss Orders: Placing stop-losses below support or above resistance levels to limit potential losses.
- Position Sizing: Determining the appropriate amount to risk on each trade based on account size and risk tolerance.
- Risk-to-Reward Ratio: Ensuring that potential rewards outweigh risks, typically aiming for a ratio of at least 2:1.
- Discipline: Adhering to predefined trading plans and avoiding emotional decision-making.
Integrating Volume with Price Action
While price action focuses primarily on price movements, incorporating volume analysis can enhance the reliability of trading signals. Volume trends can confirm the strength of price movements:
- High Volume: Indicates strong interest and conviction behind a price movement, making breakouts and trends more reliable.
- Low Volume: May suggest a lack of participation, signaling potential reversals or false breakouts.
Combining volume with price action helps traders validate signals and make more informed trading decisions.
Advanced Price Action Techniques
1. Market Structure Analysis
Analyzing the overall market structure involves understanding the larger trends and cycles that influence price movements. This includes identifying higher time frame trends and aligning trades accordingly.
2. Fibonacci Retracement Levels
Fibonacci retracement is a tool that identifies potential support and resistance levels based on the Fibonacci sequence. Traders use these levels to anticipate areas where price may reverse or consolidate.
3. Multiple Time Frame Analysis
Evaluating price action across different time frames provides a more comprehensive view of the market. For instance, aligning trades with both short-term and long-term trends can increase the probability of success.
4. Price Action Confirmation Techniques
Using additional confirmation techniques, such as divergence between price and momentum indicators, can enhance the reliability of price action signals.
Practical Applications of Price Action Trading
Price action trading can be applied in various ways depending on the trader's strategy and market conditions. Practical applications include:
- Scalping: Making quick trades to capture small price movements, often using shorter time frames like 1-minute or 5-minute charts.
- Swing Trading: Holding positions for several days to capitalize on intermediate-term trends and price swings.
- Position Trading: Maintaining trades for weeks or months, aligning with major trends and significant price movements.
- Intraday Trading: Executing trades within the same trading day, focusing on capturing intraday volatility.
Tools and Indicators Complementing Price Action
While price action primarily relies on raw price data, certain tools and indicators can complement the analysis:
- Trendlines: Visual representations of support and resistance that help identify trend directions and potential reversal points.
- Moving Averages: Smooth out price data to highlight trends and potential support/resistance areas.
- Volume Indicators: Confirm the strength of price movements and potential breakouts.
These tools should be used to enhance, not replace, the core price action analysis.
Common Misconceptions About Price Action
- Price Action Is Indicator-Free: While price action emphasizes raw price movements, traders often use complementary tools like trendlines and support/resistance levels.
- It's Only for Experienced Traders: Although it requires practice, price action trading can be learned and effectively employed by traders of all experience levels.
- Price Action Guarantees Success: Like any trading strategy, price action trading does not ensure profits and requires disciplined risk management.
Table: Common Price Action Patterns and Their Implications
| Pattern | Description | Implications |
|---|---|---|
| Head and Shoulders | A reversal pattern consisting of a peak (head) flanked by two lower peaks (shoulders). | Signals potential trend reversal from bullish to bearish. |
| Double Top/Bottom | Two distinct peaks or troughs at similar price levels. | Indicates potential reversal after failing to break support/resistance. |
| Triangles | Consolidation formations that can be ascending, descending, or symmetrical. | Suggests continuation of the current trend upon breakout. |
| Doji | A candlestick with nearly equal open and close prices. | Represents market indecision and potential reversal. |
| Pin Bar | A candlestick with a long wick and small body. | Indicates rejection of certain price levels and potential reversal. |
Psychological Aspects of Price Action
Understanding the psychology behind price movements is integral to mastering price action trading. Market sentiment, fear, greed, and investor behavior collectively influence price action. By observing how price reacts to certain levels and patterns, traders can infer the underlying psychological factors driving the market.
- Market Sentiment: The overall attitude of investors towards a particular asset, reflected in price movements.
- Fear and Greed: Emotional responses that can cause price to deviate from fundamental values.
- Trader Behavior: Patterns emerge from the collective actions of traders reacting to news, data, and price movements.
Implementing Price Action Trading: Step-by-Step Guide
Step 1: Choose the Right Market and Timeframe
Select a market you are familiar with and choose a timeframe that aligns with your trading style, whether it's intraday, swing, or position trading.
Step 2: Identify the Trend
Determine the prevailing trend using trendlines or higher time frame charts. Trading in the direction of the trend generally increases the probability of success.
Step 3: Locate Key Support and Resistance Levels
Draw horizontal lines at significant price points where the price has historically reversed or consolidated. These levels are crucial for planning entry and exit points.
Step 4: Recognize Price Patterns and Candlestick Formations
Monitor the price chart for recognizable patterns and candlestick formations that indicate potential reversals or continuations.
Step 5: Confirm with Volume (Optional)
While not mandatory, analyzing volume can provide additional confirmation for price action signals, enhancing trade reliability.
Step 6: Execute the Trade with Proper Risk Management
Enter the trade based on the identified signal, set stop-loss orders to manage risk, and determine target levels for taking profits.
Step 7: Monitor and Adjust
Continuously monitor the trade, adjusting stop-losses or taking profits as the market evolves to maximize gains and minimize losses.
Common Mistakes to Avoid in Price Action Trading
- Overcomplicating Analysis: Relying too heavily on multiple patterns or indicators can lead to confusion and indecision.
- Ignoring Market Context: Not considering the broader market trend can result in trades against the prevailing direction.
- Poor Risk Management: Failing to set appropriate stop-loss levels can lead to significant losses.
- Emotional Trading: Letting emotions dictate trading decisions can undermine a well-thought-out strategy.
- Inconsistent Application: Not adhering to a consistent trading plan can lead to erratic performance.
Tools to Enhance Price Action Trading
-
Charting Software: Platforms like TradingView, MetaTrader, and Thinkorswim offer advanced charting tools essential for price action analysis.
-
Drawing Tools: Use trendlines, Fibonacci retracement tools, and horizontal lines to mark key levels and patterns.
-
Order Flow Indicators: While not purely price action, these can provide additional insights into market dynamics.
-
Journaling Tools: Keeping a trading journal helps in reviewing and refining trading strategies based on past performance.
Conclusion
Price action trading offers a robust and flexible approach to navigating financial markets by focusing on the fundamental movements of asset prices. By understanding and interpreting patterns, trends, and key levels, traders can make informed decisions that align with the underlying market dynamics. While it requires dedication, practice, and disciplined risk management, price action trading empowers traders with a clear and effective methodology to enhance their trading performance across various markets and timeframes. Embracing its principles can lead to a deeper comprehension of market behavior, ultimately contributing to more strategic and successful trading endeavors.
References
Last updated January 18, 2025