
Exploring the Nuances of Product Moment Correlation
A deep dive into Pearson's correlation coefficient and its significance
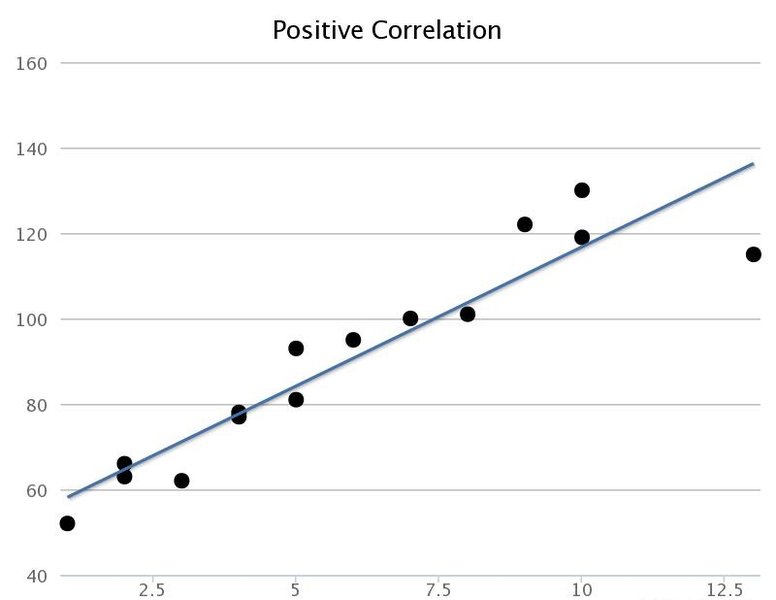
Highlights
- Linear Relationship: Understand how Pearson's correlation coefficient measures the linear association between two continuous variables.
- Calculation & Formula: Learn the mathematical basis, including the role of covariance and standard deviations in quantifying correlation.
- Assumptions & Applications: Explore critical assumptions, limitations, and diverse real-world applications in research and finance alike.
Comprehensive Overview of Product Moment Correlation
The Product Moment Correlation, often synonymous with Pearson's correlation coefficient (commonly denoted as r), is a cornerstone statistic used for assessing the strength and direction of the linear relationship between two continuous variables. This measure ranges between -1 and 1:
- A value of 1 indicates a perfect positive linear relationship.
- A value of -1 signifies a perfect negative linear relationship.
- A value of 0 represents no linear relationship.
At its core, Pearson’s product moment correlation quantifies how closely data points cluster around a straight line that best represents the relationship between two variables. While it is extensively used in the social sciences, psychology, economics, biology, and finance, its versatility also means it has a set of assumptions and limitations which are important to understand before application.
Definition and Fundamental Concept
Pearson’s correlation coefficient (r) is defined as the covariance of two variables divided by the product of their standard deviations. Formally, this calculation can be represented as:
Mathematical Representation
The formula expressed in MathJax is:
\( r = \frac{\sum (x_i - \bar{x})(y_i - \bar{y})}{\sqrt{\sum (x_i - \bar{x})^2 \sum (y_i - \bar{y})^2}} \)
Here, \( x_i \) and \( y_i \) represent the individual sample points, while \( \bar{x} \) and \( \bar{y} \) denote the mean values of the corresponding datasets. The numerator captures the covariance, which provides insight into how the variables co-vary, whereas the denominator normalizes this value by the variability of the datasets.
Interpretation of the Correlation Coefficient
Strength and Direction
The magnitude of r indicates the strength of the linear relationship:
- Weak correlation: Values near 0 suggest little to no linear relationship.
- Moderate correlation: Values in the range of 0.3 to 0.5 (or the negative counterparts) suggest a moderate relationship.
- Strong correlation: Values closer to 1 or -1 represent a strong linear connection.
The sign of r indicates the direction:
- Positive correlation: As one variable increases, the other also increases.
- Negative correlation: As one variable increases, the other decreases.
Key Assumptions and Limitations
Assumptions for Validity
The validity of the Pearson product moment correlation relies on several key assumptions:
- Linearity: The relationship between the two variables must be linear. If the association is non-linear, Pearson's r will not accurately capture the strength.
- Independence: Data points should be independent; that is, the value of one observation should not influence another.
- Measurement Level: Both variables should be measured on an interval or ratio scale. Pearson's coefficient is not appropriate for categorical data.
- Homoscedasticity: The spread of the residual data (errors) should be relatively even when plotted against the predicted values.
- Normality: For inferential purposes (e.g., constructing confidence intervals), the variables should be approximately normally distributed.
Understanding these assumptions is critical because violations can lead to misleading interpretations. For instance, the presence of outliers or non-constant variance (heteroscedasticity) may skew the results, thereby misrepresenting the true relationship between the variables.
Limitations
One must be cautious as Pearson's r only measures linear relationships. In cases where the relationship is curvilinear, the coefficient may be close to zero even if there is a strong association. Additionally, it is sensitive to outliers; even a single extreme value can disproportionately affect the calculation.
Moreover, it is imperative to note that correlation does not equal causation. While Pearson's correlation provides insight into the degree of association, it does not imply that one variable causes changes in the other.
Calculation and Practical Example
Step-by-Step Computation
To compute Pearson's correlation coefficient, the following steps are typically followed:
- Calculate the mean (\( \bar{x} \) and \( \bar{y} \)) for both datasets.
- Determine the deviations of each data point from their respective means (\( x_i - \bar{x} \) and \( y_i - \bar{y} \)).
- Multiply these deviations for corresponding data points and sum these products.
- Square the deviations for each variable, sum them separately, and take the square roots of these sums.
- Divide the sum of the products (covariance) by the product of these square root values (standard deviations).
Conceptually, this process not only provides a standardized measure of covariance but also gives a comparative measure across different datasets.
Real World Application – Insights Through a Table
To illustrate the breadth of Pearson's correlation, consider its varied applications across disciplines. The table below summarizes typical use cases alongside the assumptions, benefits, and limitations pertinent to different fields:
| Field | Typical Use | Key Assumptions | Benefits | Limitations |
|---|---|---|---|---|
| Social Sciences | Exploring relationships between variables such as education and income, or stress and health outcomes. | Linearity, normality, independence of observations | Simplifies complexity into quantifiable linear association | Does not reveal causation; sensitive to outliers |
| Finance | Analyzing asset returns correlations for portfolio diversification. | Reliability, stability over time | Standardized measure; useful for risk assessment | May not capture non-linear market dynamics |
| Biology & Medicine | Evaluating correlations between biological markers and health outcomes (e.g., correlation between dosage and response). | Continuous data; homoscedasticity, linearity | Helps identify potential areas for further causal research | Non-linear relationships may be underestimated |
| Psychology | Assessing behavioral correlations, such as study habits versus exam performance. | Linearity, absence of extreme values | Provides quick insights into relationships without intensive modeling | Doesn’t account for mediating variables |
Visualizing Correlation Insights with a Radar Chart
The radar chart below represents an opinionated analysis of various aspects influencing the effectiveness of the Pearson Product Moment Correlation. The datasets include factors like linearity, sensitivity to outliers, interpretability, assumptions adherence, and versatility across fields, among others. This visual representation offers an intuitive understanding of how these factors compare in terms of their influence on the overall performance of the Pearson correlation metric.
Integrating Multimedia Resources: Learn Through Video
To extend this understanding, you might find it beneficial to view one of the comprehensive video tutorials on Pearson's Product Moment Correlation Coefficient. The video below provides an engaging walkthrough of the calculation method and interpretation techniques:
Frequently Asked Questions
What is Pearson's Product Moment Correlation Coefficient?
Pearson's Product Moment Correlation Coefficient is a statistic that quantifies the strength and direction of the linear relationship between two continuous variables. It is symbolized by r and varies between -1 and 1.
How is the Pearson correlation coefficient calculated?
The coefficient is calculated using the formula r = ∑[(xi– x̄)(yi– ȳ)] / √[∑(xi– x̄)2∑(yi– ȳ)2], where each data point's deviation from the mean is used to compute the covariance, normalized by the standard deviations of both variables.
What assumptions must be met for the Pearson correlation coefficient?
The assumptions include linearity in the relationship, independence of observations, homoscedasticity (constant variance), and that the data are measured on an interval or ratio scale. Additionally, for inferences, the data should be approximately normally distributed.
When should alternative correlation measures be used?
If the data are ordinal instead of continuous or if the relationship is non-linear, alternative measures such as Spearman’s rank correlation coefficient or Kendall’s tau should be used. These alternatives better capture non-parametric, monotonic relationships.
References
- Strength of Correlation - NCL
- Pearson Correlation Coefficient Statistical Guide - Laerd Statistics
- Pearson Correlation Explained - Scribbr
- Pearson Product Moment Correlation - GeeksforGeeks
- Pearson Correlation Coefficient - Wikipedia
Recommended Queries for Further Exploration
Last updated April 2, 2025