
Profitability Unpacked: Gross Margin vs. Profit Margin & Beyond
Decoding the key financial metrics that reveal a company's true financial health and operational efficiency.
Understanding how a company generates profit is fundamental to assessing its financial vitality. Metrics like gross margin and profit margin are often discussed, but what do they really mean, and how do they differ? Alongside other crucial financial indicators, they paint a picture of a company's efficiency, stability, and overall performance. Let's delve into these essential tools used by managers, investors, and analysts.
Key Insights at a Glance
- Gross Margin focuses narrowly on production efficiency, showing profit relative to the direct costs (Cost of Goods Sold - COGS) of producing goods or services.
- Profit Margin is a broader category, encompassing Operating Profit Margin (profit after COGS and operating expenses) and Net Profit Margin (the final profit after all expenses, including interest and taxes).
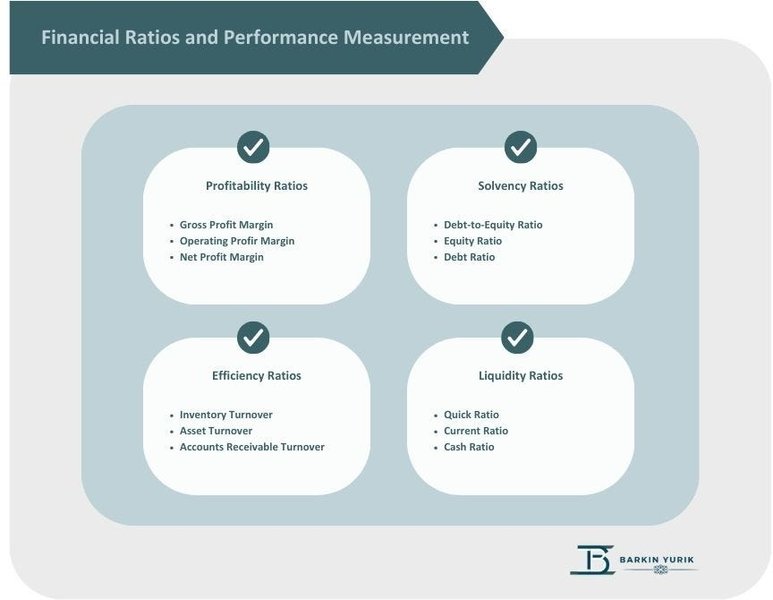
- A holistic view requires analyzing multiple metrics, including efficiency ratios (like ROA, ROE) and solvency ratios (like Debt-to-Equity), alongside profitability margins to fully grasp a company's financial standing.
Decoding Gross Margin: The First Layer of Profitability
What is Gross Margin?
Gross Margin, often expressed as Gross Profit Margin, is a fundamental profitability metric that measures how efficiently a company produces its goods or delivers its services. It represents the percentage of total revenue that the company retains as gross profit after accounting for the direct costs associated with producing those goods or services, known as the Cost of Goods Sold (COGS). COGS includes direct materials, direct labor, and manufacturing overhead directly attributable to production.
Calculating Gross Margin
The calculation involves two steps. First, determine the Gross Profit, which is an absolute dollar amount:
\[ \text{Gross Profit} = \text{Total Revenue} - \text{Cost of Goods Sold (COGS)} \]Then, calculate the Gross Margin percentage:
\[ \text{Gross Margin} = \left( \frac{\text{Gross Profit}}{\text{Total Revenue}} \right) \times 100\% \]For example, if a company has $1,000,000 in revenue and $600,000 in COGS, its Gross Profit is $400,000. The Gross Margin would be ($400,000 / $1,000,000) * 100% = 40%.
What Gross Margin Reveals
A higher Gross Margin generally indicates greater efficiency in the production process and stronger pricing power. It signifies that a larger portion of each sales dollar is available to cover operating expenses, interest, taxes, and ultimately contribute to net profit. Comparing a company's gross margin over time and against industry peers provides valuable insights into its competitive positioning and operational health at the production level.
Profit Margin Unveiled: Beyond the Basics
Understanding Profit Margin Categories
While "Profit Margin" can sometimes be used loosely, it technically refers to several distinct metrics that measure profitability at different stages after accounting for various costs. The two most crucial types are Operating Profit Margin and Net Profit Margin.
Operating Profit Margin: Gauging Operational Efficiency
Operating Profit Margin provides a view of profitability from core business operations, before considering the effects of financing (interest) and taxes. It accounts for both COGS and operating expenses (OpEx), which include selling, general, and administrative (SG&A) costs like salaries, rent, marketing, and utilities. It reflects how well a company manages its overall operations.
First, calculate Operating Income (also known as Earnings Before Interest and Taxes, or EBIT):
\[ \text{Operating Income (EBIT)} = \text{Gross Profit} - \text{Operating Expenses} \]Then, calculate the Operating Profit Margin:
\[ \text{Operating Profit Margin} = \left( \frac{\text{Operating Income}}{\text{Total Revenue}} \right) \times 100\% \]A company with $1,000,000 revenue, $400,000 gross profit, and $200,000 operating expenses has an operating income of $200,000 and an operating margin of 20%.
Net Profit Margin: The Bottom Line
Net Profit Margin is often considered the ultimate measure of profitability. It represents the percentage of revenue remaining as profit after all expenses – COGS, operating expenses, interest payments on debt, and taxes – have been deducted. This is the "bottom line" profit attributable to shareholders.
First, calculate Net Income:
\[ \text{Net Income} = \text{Operating Income} - \text{Interest Expense} - \text{Taxes} \]Then, calculate the Net Profit Margin:
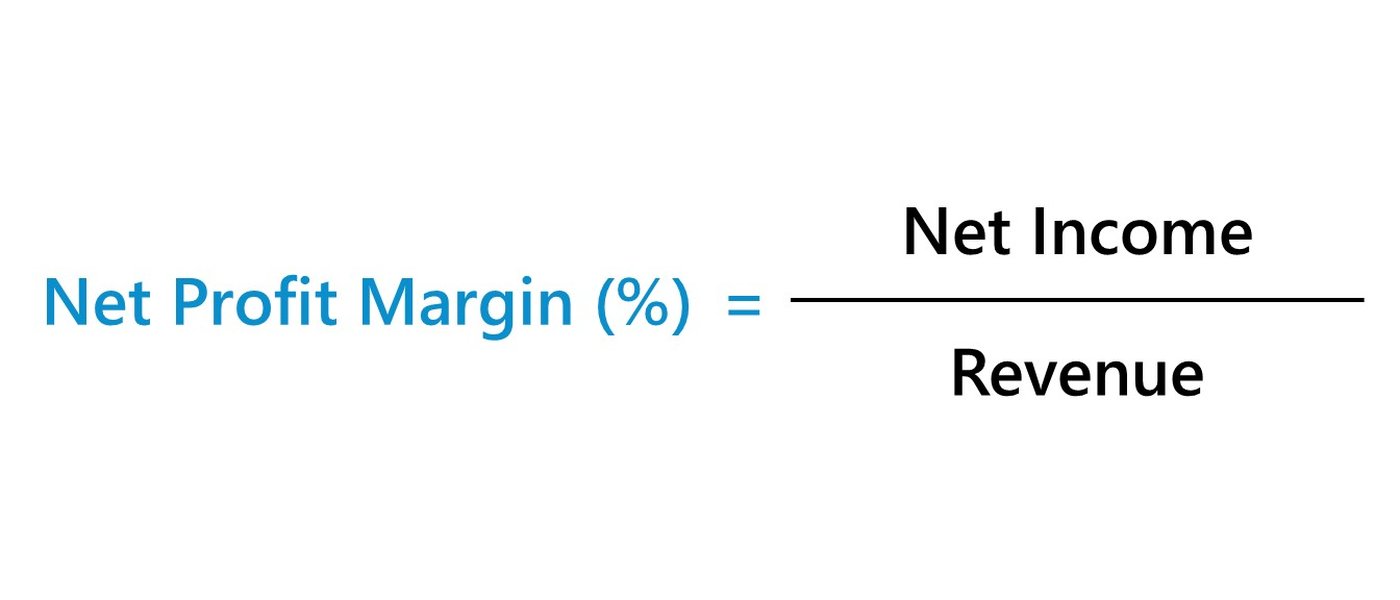
\[ \text{Net Profit Margin} = \left( \frac{\text{Net Income}}{\text{Total Revenue}} \right) \times 100\% \]If the company above also had $50,000 in interest and taxes, its Net Income would be $150,000, resulting in a Net Profit Margin of 15%.
Gross Margin vs. Profit Margin: Key Distinctions
Understanding the differences between these margins is crucial for accurate financial analysis:
Scope of Costs Considered
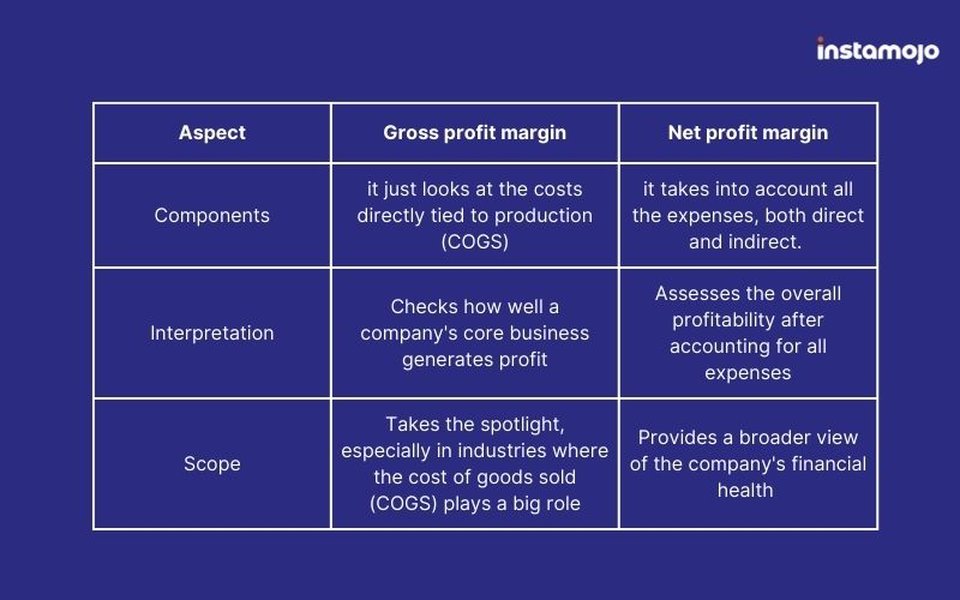
- Gross Margin: Only considers the direct Cost of Goods Sold (COGS). It isolates profitability related purely to production or service delivery.
- Operating Margin: Considers COGS plus Operating Expenses (SG&A, R&D, etc.). It measures the profitability of the core business operations.
- Net Margin: Considers all expenses, including COGS, Operating Expenses, Interest, and Taxes. It reflects the overall profitability after factoring in financing decisions and tax obligations.
Insights Provided
- Gross Margin: Indicates production efficiency, cost control for direct inputs, and pricing strategy effectiveness relative to direct costs.
- Operating Margin: Shows how well the company manages its day-to-day business activities and controls overhead costs. It's useful for comparing operational efficiency between companies, regardless of their debt structure or tax situation.
- Net Margin: Reveals the final profit generated per dollar of revenue, showing the company's overall success in generating returns for its owners after all obligations are met.
A company might have a high Gross Margin but a low Operating Margin if its overhead costs are excessive. Similarly, high debt levels (leading to high interest expenses) or high tax rates can significantly reduce the Net Margin even if the Operating Margin is healthy.
Visualizing Financial Health: A Comparative Metrics Analysis
Comparing companies requires looking at multiple metrics simultaneously. The radar chart below illustrates how three hypothetical companies in the same sector might stack up across key financial performance indicators. Company A shows strong margins but lower asset efficiency (ROA) and higher leverage (Debt/Equity). Company B demonstrates balanced performance, while Company C excels in efficiency (ROA, ROE) but has lower margins, perhaps due to a different strategy (e.g., high volume, low margin). This visualization helps highlight the trade-offs and varying strengths across businesses.
Mapping the Profitability Journey
The journey from total revenue to net income involves several steps where costs are deducted. This mindmap visualizes the flow, showing how Gross Profit, Operating Income, and Net Income are derived, and which margins correspond to each stage. Understanding this hierarchy helps clarify how different expenses impact the final profitability figures.
(Revenue - COGS)"] ::icon(fa fa-dollar-sign) ["Gross Margin %
(Gross Profit / Revenue)"] ["Operating Expenses
(SG&A, R&D, etc.)"] ["Operating Income (EBIT)
(Gross Profit - OpEx)"] ::icon(fa fa-cogs) ["Operating Margin %
(Operating Income / Revenue)"] ["Interest & Taxes"] ["Net Income
(Operating Income - Interest - Taxes)"] ::icon(fa fa-balance-scale) ["Net Profit Margin %
(Net Income / Revenue)"] ["Other Key Metrics"] ["Efficiency Ratios"] ["Return on Assets (ROA)"] ["Return on Equity (ROE)"] ["Solvency Ratios"] ["Debt-to-Equity Ratio"] ["Valuation Ratios"] ["Price-to-Earnings (P/E)"] ["Earnings Per Share (EPS)"]
Expanding the Financial Toolkit: Other Vital Metrics
While margins are critical, a comprehensive financial assessment incorporates other metrics that measure different aspects of performance:
Efficiency and Return Metrics
Return on Assets (ROA)
ROA measures how effectively a company uses its assets to generate profit. A higher ROA indicates better asset efficiency.
\[ \text{ROA} = \left( \frac{\text{Net Income}}{\text{Average Total Assets}} \right) \times 100\% \]Return on Equity (ROE)
ROE measures the return generated on the shareholders' investment (equity) in the company. It's a key indicator for investors assessing profitability from their perspective.
\[ \text{ROE} = \left( \frac{\text{Net Income}}{\text{Average Shareholder's Equity}} \right) \times 100\% \]Solvency and Valuation Metrics
Debt-to-Equity (D/E) Ratio
This ratio indicates the company's financial leverage by comparing its total liabilities to its shareholder equity. A higher ratio suggests higher risk, as the company relies more on debt financing.
\[ \text{Debt-to-Equity Ratio} = \frac{\text{Total Debt}}{\text{Total Shareholder's Equity}} \]Price-to-Earnings (P/E) Ratio
The P/E ratio compares a company's current share price to its earnings per share (EPS). It helps investors gauge market expectations about future earnings growth. A high P/E might suggest the stock is overvalued or that high growth is expected.
\[ \text{P/E Ratio} = \frac{\text{Market Value per Share}}{\text{Earnings Per Share (EPS)}} \]Earnings Per Share (EPS)
EPS represents the portion of a company's profit allocated to each outstanding share of common stock, serving as an indicator of profitability on a per-share basis.
\[ \text{EPS} = \frac{\text{Net Income} - \text{Preferred Dividends}}{\text{Average Outstanding Common Shares}} \]Financial Metrics in Action: A Summary Table
This table provides a quick reference guide to the key financial metrics discussed, summarizing their formulas and primary purpose in financial analysis.
| Metric | Formula | What it Measures |
|---|---|---|
| Gross Profit | Revenue - COGS | Profitability after direct production costs (absolute $). |
| Gross Margin | (Gross Profit / Revenue) x 100% | Percentage of revenue retained after COGS; measures production efficiency. |
| Operating Income (EBIT) | Gross Profit - Operating Expenses | Profitability from core business operations before interest and taxes (absolute $). |
| Operating Margin | (Operating Income / Revenue) x 100% | Percentage of revenue retained after COGS and operating expenses; measures operational efficiency. |
| Net Income | Operating Income - Interest - Taxes | Overall profitability after all expenses (absolute $). |
| Net Profit Margin | (Net Income / Revenue) x 100% | Percentage of revenue retained as final profit; measures overall profitability. |
| Return on Assets (ROA) | (Net Income / Average Total Assets) x 100% | Efficiency in using assets to generate profit. |
| Return on Equity (ROE) | (Net Income / Average Shareholder's Equity) x 100% | Return generated on shareholders' investment. |
| Debt-to-Equity (D/E) Ratio | Total Debt / Total Shareholder's Equity | Company's financial leverage and risk. |
| Earnings Per Share (EPS) | (Net Income - Preferred Dividends) / Avg. Outstanding Shares | Profitability allocated per share of common stock. |
| Price-to-Earnings (P/E) Ratio | Share Price / EPS | Market valuation relative to earnings; indicator of growth expectations. |
Visual Insights into Financial Performance
Visual aids can often clarify complex financial concepts. The images below provide graphical representations related to profit margins and financial performance analysis, illustrating formulas and comparisons that help solidify understanding.
Deeper Dive: Understanding Profit Margins
For an auditory and visual explanation, the following video breaks down the concepts of Profit Margin and Gross Margin, explaining how they are calculated and what insights they offer into a business's financial health. It reinforces the key differences and calculations discussed above.
Frequently Asked Questions (FAQs)
What is the main difference between Gross Margin and Net Margin?
The main difference lies in the expenses deducted from revenue. Gross Margin only subtracts the Cost of Goods Sold (COGS), reflecting profitability from production/core service delivery. Net Margin subtracts all expenses, including COGS, operating expenses (like salaries, rent, marketing), interest, and taxes, showing the final "bottom-line" profitability.
Is a higher Gross Margin always better?
Generally, a higher Gross Margin is desirable as it indicates better production efficiency or pricing power. However, it's only part of the story. A company can have a high Gross Margin but still be unprofitable if its operating expenses, interest, or taxes are very high. Therefore, it must be analyzed alongside Operating and Net Margins.
Why is Operating Margin important?
Operating Margin is important because it shows the profitability of a company's core business operations, excluding the effects of financing decisions (interest) and tax structures. This makes it a useful metric for comparing the operational efficiency of different companies within the same industry, regardless of their capital structure or tax jurisdiction.
How do these margins relate to financial statements?
These margins are primarily derived from the Income Statement. Revenue is the top line. Subtracting COGS yields Gross Profit (used for Gross Margin). Subtracting Operating Expenses from Gross Profit gives Operating Income (used for Operating Margin). Finally, subtracting Interest and Taxes from Operating Income results in Net Income (used for Net Profit Margin).
Can a company have a negative profit margin?
Yes, absolutely. If a company's total expenses exceed its total revenue, its Net Income will be negative (a net loss), resulting in a negative Net Profit Margin. Similarly, if operating expenses are very high, the Operating Margin could be negative even if the Gross Margin is positive. A negative Gross Margin indicates the direct costs of production exceed sales revenue, which is generally unsustainable.
References
- Gross Profit Margin vs. Net Profit Margin: What's the Difference? - Investopedia
- 13 Financial Performance Measures Managers Should Monitor - HBS Online
- Profit Margin vs. Operating Margin: What's the Difference? - Investopedia
- Financial KPIs & Metrics to Track - NetSuite
- Gross Profit vs Gross Margin | Definition and Key Differences - Finance Strategists
- Financial Performance: Definition, How it Works, and Example - Investopedia
- Financial Performance Metrics Every Investor Should Know - FINRA
Recommended Reading
Last updated April 6, 2025