
Unlocking the Third Dimension: Your Guide to Python 3D Libraries
Dive into Python's powerful ecosystem for 3D visualization, data processing, and application development.
Python has emerged as a versatile language for tackling a wide array of 3D tasks, from intricate scientific visualizations and complex data analysis to immersive game development and interactive applications. Its rich ecosystem of libraries empowers developers and researchers to bring three-dimensional concepts to life. This guide explores the prominent Python libraries available as of May 2025, helping you choose the right tools for your 3D projects.
Key Highlights of Python in 3D
- Versatility: Python offers libraries for diverse 3D applications, including static plotting, interactive scientific visualization, mesh and point cloud processing, and real-time 3D graphics for games and simulations.
- Interoperability: Many Python 3D libraries are built upon robust, lower-level toolkits like VTK (Visualization Toolkit) or OpenGL, providing high performance while maintaining Python's ease of use.
- Strong Community and Open Source: A majority of these tools are open-source, benefiting from active communities that contribute to their development, documentation, and provide ample support.
Navigating the Python 3D Library Landscape
The choice of a Python 3D library largely depends on your specific requirements. Below, we categorize and explore some of the most influential libraries in the Python 3D domain.
Foundational Plotting: Matplotlib
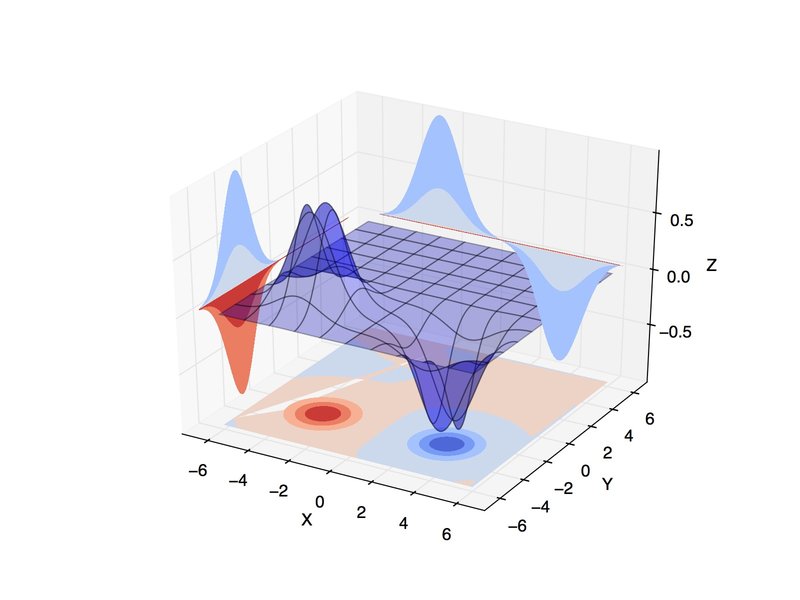
A 3D surface plot with projected contours, demonstrating Matplotlib's 3D capabilities.
Matplotlib, while primarily known for 2D plotting, includes the mplot3d toolkit, which provides basic 3D plotting functionalities. It's an excellent starting point for simpler 3D visualizations.
Key Features:
- Supports scatter plots, line plots, wireframes, surface plots, and contour plots.
- Integrates seamlessly with the broader Matplotlib ecosystem and NumPy.
- Good for generating static, publication-quality 3D graphs.
Limitations:
- Primarily generates static plots with limited interactivity.
- Does not support hardware acceleration, which can lead to performance issues with very large datasets.
Installation:
pip install matplotlib numpyExample: 3D Surface Plot
import matplotlib.pyplot as plt
from mpl_toolkits.mplot3d import Axes3D
import numpy as np

# Generate data
X = np.arange(-5, 5, 0.25)
Y = np.arange(-5, 5, 0.25)
X, Y = np.meshgrid(X, Y)
R = np.sqrt(X**2 + Y**2)
Z = np.sin(R)

# Create the plot
fig = plt.figure()
ax = fig.add_subplot(111, projection='3d')
ax.plot_surface(X, Y, Z, cmap='viridis')

ax.set_xlabel('X axis')
ax.set_ylabel('Y axis')
ax.set_zlabel('Z axis')
ax.set_title('3D Surface Plot')

plt.show()
Advanced Scientific and Interactive Visualization
For more complex scientific visualizations, interactive exploration of 3D data, and handling large datasets, specialized libraries are often preferred.
PyVista
PyVista is a user-friendly Python library for 3D visualization and mesh analysis. It acts as a high-level API to the powerful Visualization Toolkit (VTK), making complex 3D visualizations more accessible.
- Features: Supports various mesh types, volumetric rendering, plotting of scalar and vector fields, and creating interactive scenes. It can load and save multiple mesh formats.
- Use Cases: Ideal for geophysical data, computational fluid dynamics (CFD), engineering analysis, and general scientific visualization.
- Installation:
pip install pyvista vtk
import pyvista as pv
import numpy as np

# Create a simple sphere mesh
sphere = pv.Sphere(radius=1.0, center=(0, 0, 0))

# Plot the mesh interactively
plotter = pv.Plotter()
plotter.add_mesh(sphere, color='skyblue', style='surface', show_edges=True)
plotter.add_axes()
plotter.show_grid()
plotter.camera_position = 'xy'
plotter.show()
Mayavi
Mayavi is another powerful 3D scientific data visualizer, also built on VTK. It provides a comprehensive suite of tools for visualizing scalar, vector, and tensor fields, as well as mesh data.
- Features: Offers a rich GUI for interactive data exploration, scriptable through Python, and can be embedded in applications. Supports complex visualization pipelines.
- Use Cases: Widely used in scientific research for visualizing simulation results, medical imaging data, and complex datasets.
- Installation:
pip install mayavi(Dependencies like VTK might need careful handling).
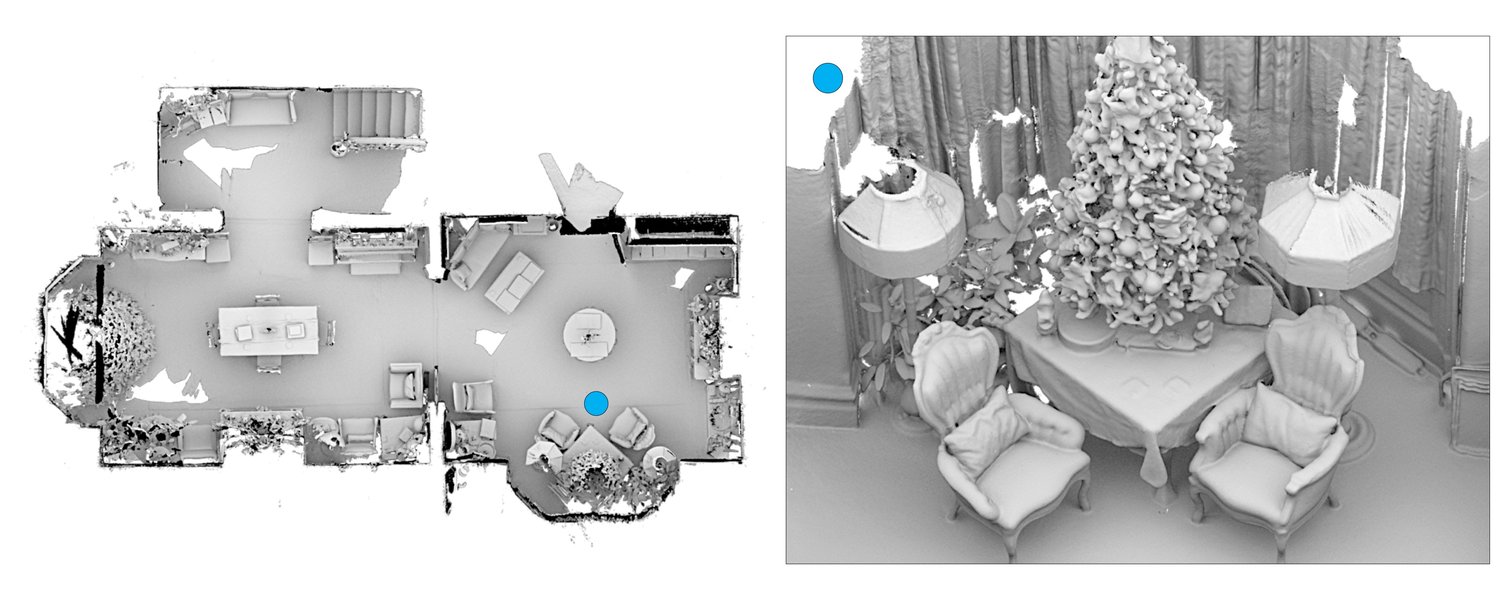
Demonstration of 3D reconstruction, a common task facilitated by libraries like Open3D.
Open3D
Open3D is a modern, open-source library that focuses on 3D data processing and visualization. It provides optimized data structures and algorithms for point clouds, meshes, and RGB-D images.
- Features: Efficient point cloud processing (registration, segmentation), mesh generation and manipulation, 3D reconstruction, and an interactive visualizer. Supports both Python and C++ APIs.
- Use Cases: Robotics, 3D scanning, computer vision, academic research involving 3D data.
- Installation:
pip install open3d
import open3d as o3d
import numpy as np

# Create a sample point cloud
points = np.random.rand(100, 3)  # 100 random 3D points
pcd = o3d.geometry.PointCloud()
pcd.points = o3d.utility.Vector3dVector(points)
pcd.paint_uniform_color([0.5, 0.5, 0.5]) # Gray color

# Visualize the point cloud
o3d.visualization.draw_geometries([pcd])
Plotly
Plotly is renowned for creating interactive, web-based visualizations. Its Python library can generate a variety of 3D charts, including scatter plots, surface plots, and mesh plots, that are inherently interactive (zoom, pan, rotate).
- Features: Produces high-quality, interactive 3D charts ideal for web dashboards and online sharing. Supports a wide range of chart types.
- Use Cases: Data science dashboards, exploratory data analysis, creating shareable interactive reports.
- Installation:
pip install plotly
Comparative Overview of Key 3D Libraries
The radar chart below provides a visual comparison of several popular Python 3D libraries based on common evaluation criteria. The scores are opinionated, reflecting general capabilities and common perceptions in the community. A higher score indicates stronger capability in that specific dimension.
This chart highlights that libraries like PyVista and Open3D excel in scientific visualization and mesh processing, while Matplotlib is easier for basic plots, and Panda3D is tailored for real-time graphics and game development.
3D Game Development and Real-Time Graphics
For creating interactive 3D applications, simulations, or games, Python offers dedicated game engines and graphics libraries.
Panda3D
A glimpse into Panda3D game development, showcasing its 3D rendering capabilities.
Panda3D is a powerful, open-source 3D game engine that uses Python (and C++) for scripting. It's a full-featured engine suitable for developing complex 3D games and simulations.
- Features: Real-time rendering, physics integration (e.g., Bullet physics), audio, AI, networking, and extensive asset pipeline support.
- Use Cases: Game development, interactive simulations, educational software, virtual reality projects.
- Installation:
pip install Panda3D
from direct.showbase.ShowBase import ShowBase

class MyApp(ShowBase):
    def __init__(self):
        ShowBase.__init__(self)

        # Load the environment model.
        self.scene = self.loader.loadModel("models/environment")
        # Reparent the model to render.
        self.scene.reparentTo(self.render)
        # Apply scale and position transforms on the model.
        self.scene.setScale(0.25, 0.25, 0.25)
        self.scene.setPos(-8, 42, 0)

app = MyApp()
app.run()
Note: The above Panda3D example assumes you have an "environment" model in a "models" directory.
Ursina Engine
Ursina is a relatively newer Python game engine built on top of Panda3D. It aims to simplify game development and make it faster to prototype 3D (and 2D) games.
- Features: Easy-to-learn API, rapid prototyping capabilities, built-in entity-component system.
- Use Cases: Indie game development, educational projects, quick 3D application prototypes.
PyOpenGL + Pygame
For those who want fine-grained control over the graphics pipeline, combining PyOpenGL (Python bindings for OpenGL) with Pygame (for windowing and event handling) is a viable option. This approach is lower-level and requires a deeper understanding of computer graphics principles.
- Features: Direct access to OpenGL API, maximal flexibility.
- Use Cases: Custom renderers, graphics research, educational tools for learning 3D graphics programming.
Python 3D Ecosystem Mindmap
This mindmap illustrates the interconnected landscape of Python libraries for various 3D tasks, helping you see how different tools fit into the broader ecosystem.
(VTK-based, mesh analysis)"] id1b["Mayavi
(VTK-based, publication quality)"] id1c["Plotly
(Interactive web charts)"] id2["General 3D Plotting"] id2a["Matplotlib
(mplot3d module, static plots)"] id3["Mesh & Point Cloud Processing"] id3a["Open3D
(Point clouds, 3D data algorithms)"] id3b["Vedo
(Scientific analysis, medical imaging)"] id3c["py3d
(Lightweight, geometric data structures)"] id3d["Trimesh
(Mesh loading, analysis, and export)"] id4["Game Development & Real-time Graphics"] id4a["Panda3D
(Full-featured game engine)"] id4b["Ursina Engine
(Simplified game dev on Panda3D)"] id4c["PyOpenGL + Pygame
(Low-level OpenGL access)"] id5["Educational & Simple 3D"] id5a["VPython (Visual Python)
(Easy syntax for simple 3D models/animations)"]
The mindmap categorizes libraries based on their primary strengths, showing dedicated paths for scientific work, general plotting, geometric data processing, and real-time applications.
Summary Table: Libraries by Use Case
This table provides a quick reference for selecting Python 3D libraries based on common use cases.
| Use Case | Recommended Libraries | Primary Strengths |
|---|---|---|
| Basic 3D Plotting | Matplotlib (mplot3d) | Simplicity, integration with NumPy/SciPy, static plots. |
| Interactive Scientific Visualization | PyVista, Mayavi, Plotly | Handling large datasets, complex geometries, interactivity, web-based sharing (Plotly). |
| 3D Data Processing (Point Clouds, Meshes) | Open3D, PyVista, Vedo, Trimesh, py3d | Geometric algorithms, point cloud registration, mesh analysis and manipulation. |
| Real-time 3D Applications & Game Development | Panda3D, Ursina Engine, PyOpenGL + Pygame | Game logic, real-time rendering, physics, asset management. |
| Educational / Simple 3D Models & Animations | VPython, Matplotlib | Ease of learning, quick prototyping of simple 3D scenes. |
The embedded YouTube video, "I build 3D APPS with this SIMPLE Python Stack (Beginner's ...)", offers a practical introduction to setting up a Python environment for 3D development. It covers aspects like selecting 3D Python libraries and configuring an IDE, which can be very helpful for beginners looking to get started with creating 3D applications using Python. The video provides a visual walkthrough that complements the textual information in this guide, potentially making the initial steps into Python 3D programming less daunting.
Frequently Asked Questions (FAQ)
Which Python 3D library is best for beginners?
Can Python handle large 3D datasets for visualization?
What's the main difference between libraries like PyVista/Open3D and game engines like Panda3D?
Do I need to know C++ or OpenGL to use these Python 3D libraries?
Recommended Further Exploration
- How can I create interactive 3D scatter plots in Python, particularly for web applications?
- Which Python libraries are best suited for processing and visualizing large LiDAR point cloud datasets?
- What are the initial steps and resources for starting 3D game development in Python with engines like Panda3D or Ursina?
- What advanced techniques are available for mesh manipulation and analysis in Python using libraries like PyVista or Trimesh?
References
Last updated May 10, 2025