
Unveiling the Foundations: A Guide to Qualitative and Quantitative Research
Exploring the core principles, methods, and applications of two pivotal research paradigms.
Embarking on any research journey, whether academic, professional, or personal, requires a fundamental understanding of how information is gathered and interpreted. Two cornerstone methodologies underpin much of this exploration: qualitative and quantitative research. Each offers a unique lens through which we can understand the world, providing different types of insights and answering different kinds of questions. This guide, current as of Monday, 2025-05-12, will illuminate the basics of these essential research approaches.
Key Insights at a Glance
- Qualitative research delves into the 'why' and 'how' of human experience, exploring depth, meaning, and context through non-numerical data like interviews and observations.
- Quantitative research focuses on 'how much' or 'how many,' using numerical data and statistical analysis to measure, test hypotheses, and identify patterns that can often be generalized to larger populations.
- Both methodologies possess distinct strengths and are often combined in mixed-methods research to achieve a more comprehensive and nuanced understanding of complex phenomena.
Delving into Qualitative Research
Qualitative research is an exploratory approach aimed at gaining a deep and nuanced understanding of human behavior, experiences, attitudes, and social phenomena. It seeks to uncover the underlying reasons and motivations, often asking "how" and "why" questions.
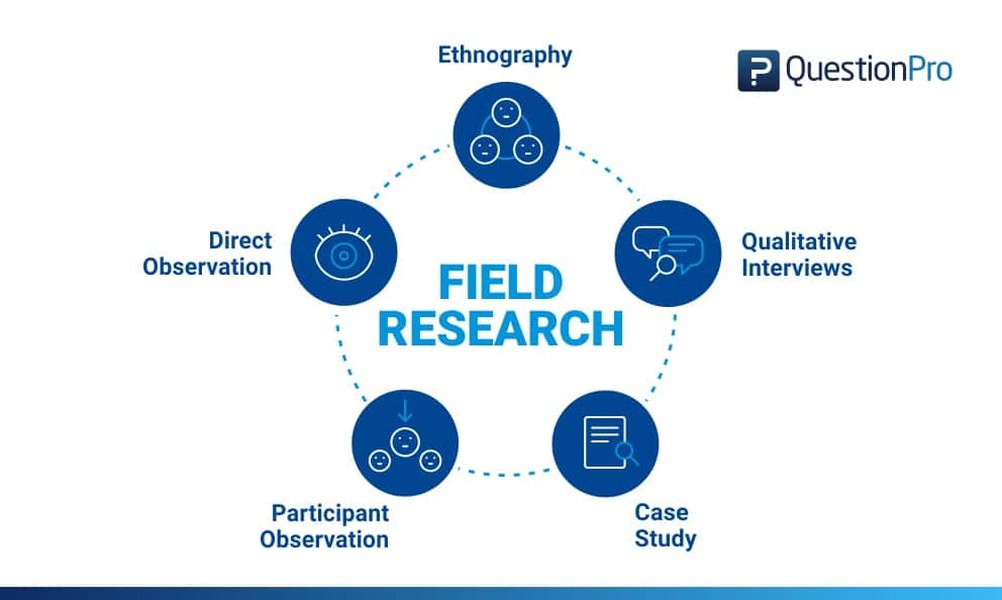
A researcher engaged in field observation, a common qualitative data collection method.
Core Purpose and Approach
Exploratory and Interpretive
The primary goal of qualitative research is to explore phenomena from the participants' perspectives. It is often used to generate hypotheses, understand complex issues in their natural setting, and provide rich, descriptive insights. The researcher is typically an integral part of the data collection process, interpreting the data to identify themes and patterns.
Types of Data Gathered
Non-Numerical and Descriptive
Qualitative data is non-numerical and encompasses a wide range of information, including:
- Text: Interview transcripts, open-ended survey responses, documents, articles, social media posts.
- Audio: Recordings of interviews, focus groups, or natural conversations.
- Images and Video: Photographs, videos of observed behaviors or environments.
- Observations: Detailed notes from observing participants in their natural settings.
This type of data is rich in detail and provides context that numbers alone cannot convey.
Common Data Collection Methodologies
Qualitative researchers employ various methods to gather data, often choosing techniques that allow for in-depth exploration:
- In-depth Interviews: One-on-one conversations where researchers ask open-ended questions to explore participants' thoughts, feelings, and experiences in detail.
- Focus Groups: Small group discussions (typically 6-10 participants) led by a moderator to explore a specific topic, allowing for interaction and the emergence of shared perspectives.
- Observation (Ethnography): Researchers immerse themselves in a particular social or cultural setting to observe behavior, interactions, and events as they naturally occur. This can be participant observation (researcher participates) or non-participant observation.
- Case Studies: In-depth investigations of a single individual, group, event, or community, drawing on multiple sources of information.
- Open-Ended Questionnaires/Surveys: Surveys that include questions allowing respondents to provide detailed, narrative answers rather than selecting from pre-defined options.
- Diary Studies: Participants keep a record of their experiences, thoughts, or activities related to a research topic over a period.
Analyzing Qualitative Data
Identifying Themes and Meanings
Qualitative data analysis is an iterative and interpretive process. It involves:
- Transcription: Converting audio or video recordings into text.
- Coding: Identifying and labeling key concepts, themes, and patterns within the data.
- Thematic Analysis: Systematically identifying, organizing, and interpreting patterns of meaning (themes) across a dataset.
- Discourse Analysis: Examining how language is used in social contexts to understand power relations, ideologies, and identities.
- Content Analysis: Systematically categorizing and interpreting textual, visual, or audio data to identify the presence of certain words, themes, or concepts.
The goal is to build a rich, descriptive narrative that explains the phenomenon under study. Different researchers might interpret the same qualitative data differently, highlighting the subjective nature of this analysis.
Defining Characteristics
- Subjectivity: The researcher's interpretations play a significant role in data analysis.
- Flexibility: Research design can evolve as new insights emerge during the study.
- Contextual Understanding: Provides deep insights into the specific context in which phenomena occur.
- Small Sample Sizes: Typically uses smaller, non-random samples selected for their ability to provide rich information (purposive sampling).
- Exploratory Nature: Often used to generate ideas, develop theories, or understand complex social realities.
Understanding Quantitative Research
Quantitative research is centered on numerical data and statistical analysis. It aims to measure variables, test hypotheses, establish relationships between variables, and generalize findings from a sample to a larger population. It primarily seeks to answer questions like "what," "where," "when," or "how many."
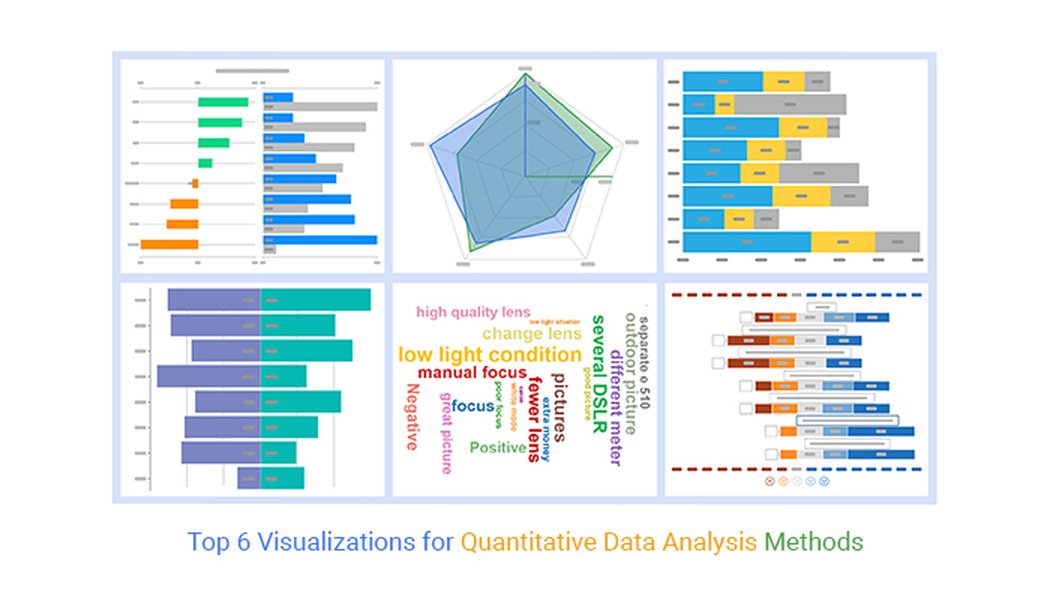
Visualizations like charts and graphs are commonly used to present findings from quantitative research.
Core Purpose and Approach
Objective Measurement and Testing
The core of quantitative research is objectivity and measurement. It employs structured methodologies to collect numerical data that can be subjected to statistical analysis. This approach is often used to confirm or refute existing theories or hypotheses and to identify prevalence, trends, and correlations.
Types of Data Utilized
Numerical and Measurable
Quantitative data is information that can be counted or measured and expressed numerically. Examples include:
- Counts: Number of customers, frequency of an event.
- Measurements: Height, weight, temperature, income.
- Ratings: Scores on a scale (e.g., customer satisfaction from 1 to 5).
- Percentages: Proportion of a population with a certain characteristic.
Common Data Collection Methodologies
Quantitative data collection methods are typically structured to ensure consistency and enable statistical comparison:
- Surveys with Closed-Ended Questions: Questionnaires that ask respondents to choose from a predefined set of answers (e.g., multiple-choice, Likert scales, yes/no questions).
- Experiments: Controlled studies where researchers manipulate one or more variables (independent variables) to determine their effect on an outcome variable (dependent variable), often involving control and experimental groups.
- Structured Observations: Systematically observing and recording specific behaviors or events according to a predefined coding scheme.
- Analysis of Existing Numerical Data: Using pre-existing datasets, such as government statistics, company databases, or financial records.
Analyzing Quantitative Data
Statistical Tools and Techniques
Quantitative data analysis involves using mathematical and statistical techniques to interpret the numbers. This can range from simple calculations to complex modeling:
- Descriptive Statistics: Summarizing data using measures like mean, median, mode, standard deviation, and frequency distributions.
- Inferential Statistics: Making inferences and predictions about a larger population based on data from a sample (e.g., t-tests, ANOVA, chi-square tests).
- Correlation Analysis: Examining the strength and direction of relationships between two or more variables.
- Regression Analysis: Predicting the value of a dependent variable based on the value of one or more independent variables.
Software such as SPSS, R, or Excel is commonly used to perform these analyses. Results are often presented in tables, charts, and graphs.
Defining Characteristics
- Objectivity: Aims for unbiased measurement and analysis, with the researcher remaining detached.
- Structured Design: Follows a predetermined and fixed research plan.
- Generalizability: Findings from a representative sample can often be generalized to a larger population.
- Large Sample Sizes: Typically requires larger, often randomly selected, samples to ensure statistical significance and representativeness.
- Confirmatory Nature: Often used to test specific hypotheses or theories.
- Replicability: Structured methods allow studies to be replicated by other researchers to verify findings.
Qualitative vs. Quantitative: A Head-to-Head Comparison
Understanding the fundamental differences between qualitative and quantitative research is crucial for selecting the appropriate methodology for a given research question. The table below provides a comparative overview of their key aspects.
| Aspect | Qualitative Research | Quantitative Research |
|---|---|---|
| Primary Objective | To explore, understand meanings, experiences, and context; generate hypotheses. Answers "why?" and "how?". | To measure variables, test hypotheses, identify patterns, and generalize findings. Answers "what?", "how many?", "when?", "where?". |
| Focus Questions | Why do people behave in a certain way? How do they experience a phenomenon? | How many people hold this opinion? What is the relationship between variable X and variable Y? |
| Data Type | Non-numerical (text, audio, images, observations). Descriptive and conceptual. | Numerical (counts, measurements, ratings). Quantifiable. |
| Data Collection Methods | In-depth interviews, focus groups, observations, case studies, open-ended surveys. | Surveys with closed-ended questions, experiments, structured observations, analysis of numerical datasets. |
| Data Analysis | Interpretive, thematic, content analysis, discourse analysis. Identifying patterns and meanings. | Statistical analysis (mean, median, standard deviation, regression, correlation). Mathematical tools. |
| Sample Size | Typically small, purposive (non-random) sampling. | Typically large, often random or representative sampling. |
| Researcher's Role | Intimately involved, interprets data subjectively. | Detached, aims for objective measurement. |
| Flexibility | High; design can be adapted as new insights emerge. | Low; structured, fixed methods and procedures. |
| Outcome | Rich descriptive summaries, themes, narratives, contextual understanding. | Statistical reports, charts, graphs, numerical data, predictions, generalizable findings. |
| Strengths | Provides depth, rich insights, understanding of context, flexibility, good for exploring new topics. | Provides objective data, generalizability, replicability, good for testing hypotheses and establishing relationships. |
| Limitations | Subjectivity, limited generalizability, time-consuming analysis, potential researcher bias. | May lack depth and context, can overlook nuances, limited flexibility. |
Visualizing the Differences: Research Characteristics
To further illustrate the contrasting characteristics of qualitative and quantitative research, the following radar chart compares them across several key dimensions. This chart represents a generalized view; specific research projects may vary. The scales range from low (closer to the center) to high (further from the center) for each characteristic, where a higher score indicates that the research type is more strongly associated with that characteristic.
This visual comparison highlights how qualitative research excels in providing depth and flexibility, while quantitative research is stronger in objectivity and generalizability. Note that "Reliance on Large Samples" being high for quantitative research indicates its typical requirement for larger sample sizes for statistical validity.
Interconnected Worlds: A Mindmap of Research Approaches
The following mindmap provides a visual summary of qualitative and quantitative research, outlining their core purposes, data types, common methods, analysis techniques, and key characteristics. It also introduces the concept of mixed methods research, which combines aspects of both approaches.
(Text, Audio, Images, Observations)"] id1_3["Methods"] id1_3_1["Interviews"] id1_3_2["Focus Groups"] id1_3_3["Observations (Ethnography)"] id1_3_4["Case Studies"] id1_4["Analysis: Interpretive & Thematic"] id1_5["Characteristics: Subjective, Flexible, In-depth, Small Samples"] id2["Quantitative Research"] id2_1["Purpose: Measure & Test 'What/How Many'"] id2_2["Data Type: Numerical
(Counts, Measurements, Ratings)"] id2_3["Methods"] id2_3_1["Surveys (Closed-ended)"] id2_3_2["Experiments"] id2_3_3["Structured Observations"] id2_4["Analysis: Statistical"] id2_5["Characteristics: Objective, Structured, Generalizable, Large Samples"] id3["Mixed Methods Research"] id3_1["Combines Qualitative & Quantitative Approaches"] id3_2["Provides Comprehensive Understanding"] id3_3["Leverages Strengths of Both"]
This mindmap illustrates that while distinct, qualitative and quantitative research are part of a broader toolkit available to researchers seeking to understand the world around them.
The Power of Synergy: Mixed Methods Research
Many research questions benefit from integrating both qualitative and quantitative approaches, a strategy known as mixed methods research. This approach allows researchers to leverage the strengths of each methodology, providing a more holistic and comprehensive understanding of the research problem.
Combining Strengths for Deeper Insights
For example, qualitative research might be used initially to explore a topic and generate hypotheses. These hypotheses can then be tested on a larger scale using quantitative methods. Conversely, quantitative findings (e.g., a statistical trend) might be further explored and explained through qualitative methods (e.g., interviews to understand the reasons behind the trend).
By combining numbers with narratives, researchers can:
- Triangulate findings: Corroborate results from different methods.
- Complement insights: Use one method to elaborate on findings from another.
- Develop a richer picture: Gain both breadth (quantitative) and depth (qualitative) of understanding.
- Address complex questions: Tackle research problems that a single method cannot fully resolve.
Choosing Your Path: When to Use Each Approach
The choice between qualitative, quantitative, or mixed methods research depends heavily on the research question, objectives, available resources, and the nature of the phenomenon being studied.
When to Opt for Qualitative Research:
- When you need to understand complex phenomena, social interactions, or individual experiences in depth.
- When you are exploring a new topic and need to generate hypotheses or develop a theory.
- When context is crucial, and you want to understand "why" and "how" something occurs.
- When you want to give voice to participants and understand their perspectives.
When to Opt for Quantitative Research:
- When you need to measure the prevalence of something (e.g., an opinion, a behavior).
- When you want to test specific hypotheses and establish cause-and-effect relationships or correlations.
- When you need to generalize findings from a sample to a larger population.
- When you require objective, numerical data to make decisions or comparisons.
Often, the most robust research designs thoughtfully consider how different approaches can be combined to answer multifaceted questions.
Deepen Your Understanding: Explanatory Video
For a dynamic explanation of the differences between qualitative and quantitative research, the following video offers clear examples and distinctions. It can help solidify your understanding of when and how each approach is typically applied.
This video, "Quantitative vs. Qualitative Research: The Differences..." from Scribbr, effectively summarizes the core concepts, data collection methods, and analysis techniques associated with each research paradigm, making complex ideas more accessible.
Frequently Asked Questions
What is the primary goal of qualitative research? +
The primary goal of qualitative research is to gain an in-depth understanding of human behavior, experiences, attitudes, and the reasons that govern such behavior. It focuses on the "why" and "how" of decision making, not just "what," "where," and "when." It aims to explore meanings and interpret phenomena from the perspective of the participants in their natural settings.
What is the primary goal of quantitative research? +
The primary goal of quantitative research is to measure objective data, test theories and hypotheses, examine relationships between variables, and generalize findings to a larger population. It uses numerical data and statistical analysis to quantify attitudes, opinions, behaviors, or other defined variables. It focuses on producing objective, empirical data that can be measured and expressed numerically.
Can qualitative and quantitative research be used together? +
Yes, absolutely. Combining qualitative and quantitative research, known as mixed methods research, is a common and often powerful approach. It allows researchers to gain a more comprehensive understanding by leveraging the depth of qualitative insights with the breadth and generalizability of quantitative data. For instance, qualitative methods can explore the "why" behind quantitative findings, or quantitative methods can test hypotheses generated from qualitative exploration.
Is one research method inherently superior to the other? +
No, neither qualitative nor quantitative research is inherently superior. The "best" method depends entirely on the research question, objectives, and the nature of the phenomenon being studied. Qualitative research excels at providing rich, contextual understanding and exploring complex issues in depth. Quantitative research is strong for measuring variables, testing hypotheses, and generalizing results. Often, the most robust insights come from choosing the method (or combination of methods) that best aligns with the research goals.
What are typical sample sizes for qualitative versus quantitative research? +
Qualitative research typically uses smaller sample sizes. The focus is on gaining deep insights from information-rich cases, so data saturation (the point at which no new information or themes are emerging) is often a guiding principle rather than a specific number. Sample sizes can range from a few participants in a case study to 15-30 for interviews or a few focus groups.
Quantitative research generally requires much larger sample sizes to ensure statistical power, representativeness, and the ability to generalize findings to a broader population. Sample sizes can range from hundreds to thousands, depending on the population size, desired margin of error, and complexity of the analysis.
Explore Further
To continue your learning journey, consider exploring these related topics:
- How can one effectively design a mixed methods research study to combine qualitative and quantitative data?
- What specific ethical considerations must researchers address when conducting qualitative research involving human participants?
- What are the different sampling techniques used in quantitative research and how do they affect generalizability?
- In what ways do researchers determine data saturation in qualitative analysis, and why is it important?
References
The information presented in this guide is synthesized from various authoritative sources. For further reading, please refer to:

Last updated May 12, 2025