
Data Analysis in Quantitative Research
Exploring the Methods and Insights from Numerical Data
Key Insights
- True Statement: Data analysis in quantitative research refers to analyzing and interpreting numerical data using statistical methods.
- Statistical Techniques: Methods like descriptive statistics, inferential analysis, regression, and correlation are central to this process.
- Purposeful Insight: The goal is to extract patterns, relationships, and trends to support research hypotheses and decision-making.
Understanding Quantitative Data Analysis
Quantitative data analysis is fundamentally about the systematic examination, interpretation, and summarization of numerical data. In the context of quantitative research, this process is critical for revealing patterns, trends, and relationships among variables. Researchers rely on various statistical techniques to convert raw data into meaningful insights. As such, the statement "Data analysis in quantitative research is the process of analysing and interpreting numerical data" is fully accurate.
Definition and Process
At its core, quantitative data analysis involves these main steps:
Data Collection
Before analysis, data is collected through means such as surveys, experiments, or observational methods. This phase is governed by strict methodologies designed to ensure objectivity and reliability of the numerical data.
Data Preparation
Once collected, data is cleaned and prepared. This includes handling any missing values, outliers, or errors, thereby ensuring a robust dataset for subsequent analysis.
Statistical Analysis
The primary phase involves the application of statistical methods:
- Descriptive Statistics: This includes means, medians, modes, ranges, standard deviations, and graphical presentations to summarize the dataset.
- Inferential Statistics: Methods such as t-tests, chi-square tests, ANOVA, and regression analysis help in making generalizations or predictions based on sample data.
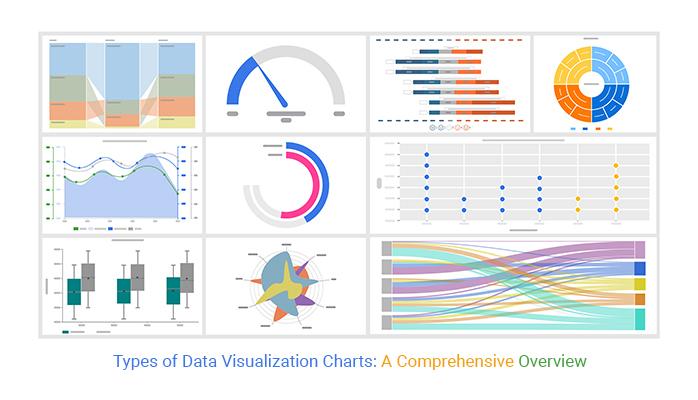
- Data Visualization: Graphs, charts, and scatter plots are employed to visually interpret relationships and trends within the data.
Each of these techniques contributes to a systematic approach to deciphering the structure inherent in numerical data, allowing researchers to validate hypotheses or explore new insights.
Why the Statement is True
The assertion that “Data analysis in quantitative research is the process of analysing and interpreting numerical data” is universally acknowledged by multiple reputable sources. This view is supported by educational and research organizations because quantitative research is uniquely engaged in numerically driven methods of inquiry. Statistical techniques transform numbers into stories, narratives, and conclusions that inform evidence-based decisions across several fields.
Core Concepts
Let’s delve into some of the core concepts of data analysis in quantitative research:
Descriptive Analysis
Descriptive analysis provides summaries that give a clear picture of the characteristics of the dataset. This includes calculating central tendencies such as the mean or median, dispersion measures like the standard deviation, and visualizing the data through histograms or bar charts.
Inferential Analysis
Inferential analysis goes beyond description to making inferences about the larger population based on sample data. Techniques such as hypothesis testing, confidence intervals, and regression models allow researchers to determine whether observed patterns are statistically significant.
Relationship Testing
Quantitative analysis frequently involves evaluating relationships between variables. Correlational studies and regression analysis help indicate whether and how strongly pairs of variables are connected. Identifying such relationships is crucial for building predictive models and informed policy-making.
Detailed Comparison Table of Quantitative Analysis Components
| Component | Description | Key Methods |
|---|---|---|
| Data Collection | Gathering numerical data through surveys, experiments, or observations. | Structured questionnaires, lab experiments, systematic observations |
| Data Preparation | Cleaning and organizing data to ensure accuracy and consistency. | Handling missing values, outlier detection, data normalization |
| Descriptive Analysis | Summarizing the basic features of the data. | Means, medians, modes, standard deviation, frequency distributions |
| Inferential Analysis | Making generalizations from sample data to a wider population. | Hypothesis testing, regression analysis, confidence intervals |
| Data Visualization | Graphically representing data to uncover patterns and trends. | Bar charts, scatter plots, histograms, line graphs |
Application and Impact
The insights derived from quantitative data analysis play a pivotal role in various fields, from economics and healthcare to marketing and education. Here are some illustrative applications:
Business and Marketing
Companies harness statistical techniques to analyze customer behavior data, optimize marketing campaigns, and predict market trends. The numerical evidence supports data-driven decisions, enhancing operational efficiency and profitability.
Healthcare
In the medical field, quantitative analysis is essential for clinical studies, determining treatment efficacy, and understanding epidemiological data. Statistical evidence from randomized controlled trials underpins evidence-based medicine.
Social Sciences
Social researchers employ quantitative techniques to study population trends, behavioral patterns, and societal changes. By analyzing survey data and demographic information, they can forecast trends and inform policy decisions.
Benefits and Limitations
Benefits
Quantitative data analysis offers several key benefits:
- Accuracy and Precision: Numerical data allows for precise measurement and statistical validation of findings.
- Generalizability: With well-designed studies, the findings can be extrapolated to larger populations.
- Objectivity: The reliance on numerical data minimizes subjective bias, thereby enhancing the credibility of conclusions.
- Flexibility: A wide range of statistical tools and software packages are available, facilitating diverse analytical approaches.
Limitations
Despite its strengths, quantitative analysis may face some challenges:
- Complexity in Data Interpretation: While numerical data is precise, interpreting it correctly requires expertise in statistical methods.
- Data Quality: The quality of the results is heavily dependent on the accuracy and reliability of the initial data collection.
- Limited Depth: Quantitative data might not capture the nuances of phenomena that are better explained through qualitative insights.
Relevant Sources and Further Reading
The clarity and universality of the statement on quantitative data analysis are echoed across multiple authoritative platforms. The references provided below from industry-leading sources illustrate the robust application and complex methodologies involved in quantitative data analysis:
References
- What is Quantitative Data Analysis - Airbyte
- Quantitative Data Analysis Guide - Hotjar
- Comprehensive Quantitative Data Analysis - Userpilot
- Quantitative Data Analysis Process - Hevo Data
- Quantitative Research Methodology - Scribbr
Related Queries and Further Exploration
If you are interested in exploring the nuances of quantitative research further, consider delving into the following topics:
Summative Notes
To summarize, the process of quantitative data analysis is undeniably centered on objectively interpreting numerical information. The techniques discussed not only provide a pathway for verifying hypotheses but also for rigorously validating research findings. This structured approach underpins decision-making in various fields and continues to evolve as new statistical methods and computational tools become available.
Last updated March 19, 2025