
Comprehensive Guide to Creating Diagrams for Reference Architecture and Delivery Plan During RFP Orals for IT Projects
Visualizing Your Project's Blueprint and Execution Strategy
Key Takeaways
- Clear Visualization: Diagrams enhance understanding by providing a visual representation of complex architectures and timelines.
- Structured Planning: A well-defined delivery plan ensures all project phases are aligned with business objectives and stakeholder expectations.
- Effective Communication: Combining reference architecture and delivery plan diagrams facilitates cohesive communication during RFP orals.
Introduction
When participating in RFP (Request for Proposal) orals for IT projects, presenting a clear and structured visual representation of your proposed solution is crucial. Diagrams not only simplify complex information but also demonstrate your team's ability to plan and execute effectively. This guide delves into creating Reference Architecture and Delivery Plan diagrams, ensuring your presentation stands out and resonates with stakeholders.
Understanding Reference Architecture
What is Reference Architecture?
Reference Architecture serves as a blueprint for your IT solution, outlining the key components, their interactions, and the overall structure necessary to achieve project goals. It provides stakeholders with a high-level overview, ensuring everyone has a clear understanding of the proposed system's framework.
Key Elements of Reference Architecture Diagrams
1. Architectural Layers
Divide the architecture into distinct layers to showcase the separation of concerns and the flow of data:
- Presentation Layer: User interfaces such as web or mobile applications.
- Application Layer: Business logic and application services, including APIs and microservices.
- Data Layer: Databases, data warehouses, and storage solutions.
- Infrastructure Layer: Servers, cloud services, and networking components.
2. Integration Points
Illustrate how external systems, third-party APIs, or legacy systems integrate with your solution. This highlights interoperability and the ability to leverage existing technologies.
3. Security Components
Detail security measures such as firewalls, encryption protocols, authentication mechanisms, and identity access management (IAM) to emphasize the system's robustness and data protection.
4. Scalability and Redundancy
Showcase elements like load balancers, failover systems, and auto-scaling capabilities that ensure the solution can handle growth and maintain high availability.
5. Technology Stack
Annotate the diagram with specific technologies, frameworks, and services (e.g., AWS Lambda, Azure Kubernetes Service, PostgreSQL) to provide clarity on the tools and platforms used.
Example Structures
Layered Architecture Diagram
Represents each architectural layer and the interactions between them. For instance:
- Top Layer: User Interface (Web/Mobile Apps)
- Middle Layer: Application Services (APIs, Microservices)
- Bottom Layer: Data Storage (Databases, Data Lakes)
- Connectors: Arrows indicating data flow and integration points.
System Interaction Diagram
Focuses on how different systems and services communicate. This includes protocols like REST APIs, SOAP, and message queues, highlighting the flow of data and interactions.
Cloud-Specific Architecture Diagram
Uses predefined icons and components from cloud providers (AWS, Azure, GCP) to outline the cloud infrastructure, services used, and their configurations.
Best Practices for Reference Architecture Diagrams
- Consistency: Use standardized symbols and notation to maintain uniformity.
- Clarity: Avoid clutter by focusing on essential components and their interactions.
- Annotations: Provide brief descriptions or labels to explain complex elements.
- Color Coding: Utilize colors to differentiate between layers, components, or functionalities.
- Legends: Include a legend to help stakeholders understand symbols and color schemes used.
Crafting the Delivery Plan
What is a Delivery Plan?
The Delivery Plan outlines the timeline, phases, milestones, and resource allocation necessary to implement the proposed architecture. It ensures all stakeholders are aligned on the project's execution strategy and key deliverables.
Key Elements of Delivery Plan Diagrams
1. Project Phases
Break down the project into distinct phases to provide a clear roadmap. Common phases include:
- Discovery and Planning: Requirements gathering, stakeholder analysis, and detailed planning.
- Design and Development: Architectural design, coding, and integration of systems.
- Testing and Quality Assurance: System testing, user acceptance testing (UAT), and bug fixing.
- Deployment and Go-Live: Final deployment, user training, and system rollout.
- Post-Implementation Support: Ongoing maintenance, support, and iterative improvements.
2. Milestones
Identify key deliverables or decision points within each phase. Examples include:
- Prototype Approval
- Completion of UAT
- Final Deployment
3. Timeline Visualization
Use Gantt charts or horizontal timelines to depict the duration and sequence of each project phase. This provides a temporal perspective of the project's progression.
4. Dependencies
Illustrate how tasks and milestones are interdependent. Arrows or annotations can indicate which tasks rely on the completion of others, ensuring that the project flow is logical and sequential.
5. Resource Allocation
Visualize how resources (team members, tools, budget) are distributed across different phases. This can be represented using resource grids or allocation charts to ensure optimal utilization.
Example Structures
Gantt Chart
Displays project phases along a horizontal timeline with bars representing the duration of each task. Milestones are marked with symbols like dots or flags.
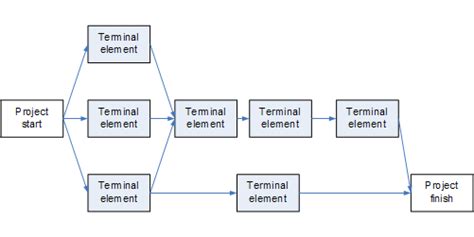
Critical Path Diagram
Highlights the sequence of crucial tasks that determine the project's duration. This helps in identifying which tasks cannot be delayed without affecting the overall timeline.
Resource Grid
Maps out team members and their responsibilities across different project phases, ensuring clear accountability and workload distribution.
Best Practices for Delivery Plan Diagrams
- Detail-Oriented: Provide sufficient detail to convey the execution strategy without overwhelming the viewer.
- Alignment with Objectives: Ensure that each phase and milestone aligns with the project's overarching goals.
- Flexibility: Incorporate buffers or contingency plans to accommodate unforeseen challenges.
- Visual Clarity: Use distinct colors and shapes to differentiate between phases, tasks, and milestones.
- Stakeholder-Friendly: Design diagrams that are easily understandable by both technical and non-technical stakeholders.
Integrating Reference Architecture with Delivery Plan
Combined Diagrams for RFP Orals
During RFP orals, presenting a combined view of Reference Architecture and Delivery Plan can effectively demonstrate your comprehensive understanding of both the technical and execution aspects of the project. Here's how to structure such a presentation:
- Left Side: Display the Reference Architecture Diagram to provide a high-level technical overview.
- Right Side: Present the Delivery Plan Diagram to outline the project's timeline and phases.
- Annotations: Use callouts or notes to explain how specific architectural components support various phases of the delivery plan.
Benefits of Combining Diagrams
- Cohesive Presentation: Demonstrates how the technical architecture aligns with the project execution strategy.
- Enhanced Understanding: Helps stakeholders see the interconnection between system components and project milestones.
- Confidence Building: Reinforces your team's capability to deliver a robust solution within the proposed timeline.
Visualization Example
| Reference Architecture | Delivery Plan |
|---|---|
|
|
Tools and Technologies for Diagram Creation
Recommended Diagramming Tools
- Microsoft Visio: A versatile tool for creating detailed architecture and flow diagrams.
- Lucidchart: An online platform offering collaborative diagramming capabilities with a wide range of templates.
- Miro: A digital whiteboard tool ideal for brainstorming and creating interactive diagrams.
- EdrawMax: Provides extensive diagramming options with industry-specific templates.
- AWS/Azure Diagramming Tools: Utilize cloud-specific components for accurate architecture representations.
Best Practices for Using Diagramming Tools
-
Template Utilization: Leverage pre-built templates to save time and ensure consistency.
-
Collaboration Features: Use tools that support real-time collaboration for team-based diagram creation.
-
Version Control: Maintain different versions of your diagrams to track changes and updates.
-
Export Options: Ensure diagrams can be exported in various formats (PNG, PDF, etc.) for easy sharing.
-
Integration Capabilities: Use tools that integrate with other software like project management systems or documentation platforms.
Best Practices for Presenting Diagrams During RFP Orals
Simplify Complex Information
Avoid overwhelming your audience with excessive technical details. Focus on essential components and their interactions to convey the core aspects of your solution.
Align Diagrams with Your Narrative
Ensure that each diagram supports the story you're telling during your presentation. Use them as visual aids to reinforce key points, not as standalone elements.
Tailor Content to the Audience
Understand the technical proficiency of your audience and adjust the complexity of your diagrams accordingly. Make sure the visuals are accessible to both technical and non-technical stakeholders.
Use Clear Legends and Annotations
Include legends to explain symbols, colors, and notations used in your diagrams. Annotations can provide additional context and clarify complex elements.
Maintain Consistency
Use a consistent style across all diagrams to create a cohesive and professional presentation. This includes uniform colors, fonts, and symbol usage.
Engage with Visuals
Encourage interaction by highlighting key components or phases during your explanation. Use animations or transitions sparingly to draw attention to important aspects without causing distraction.
Conclusion
Creating effective Reference Architecture and Delivery Plan diagrams is pivotal in conveying the technical and execution facets of your IT projects during RFP orals. By adhering to best practices and utilizing the right tools, you can craft visuals that not only inform but also engage and persuade stakeholders of your solution's viability and your team's capability to deliver it successfully.
References
For further insights and resources on creating effective diagrams and structuring RFP orals, consider the following:
 aws.amazon.com
Last updated January 19, 2025