
Unveiling the Spectrum: A Deep Dive into RGB, HSV, and CIE Color Models
Exploring the Foundations of Color Representation in Digital and Perceptual Spaces
Color is a fundamental aspect of human perception and a critical element in digital media, computer graphics, and various scientific disciplines. To accurately represent, manipulate, and reproduce colors, various color models have been developed. These models provide structured systems for describing colors, each optimized for different applications and reflecting distinct approaches to color creation and perception. This comprehensive explanation will delve into three pivotal color models: the RGB Color Model, the HSV Color Model, and the CIE Chromaticity Diagram, exploring their underlying principles, characteristics, and practical applications.
Key Insights into Color Models
- RGB (Red, Green, Blue) is an additive color model primarily used for digital displays, where light is combined to create a wide range of colors.
- HSV (Hue, Saturation, Value) is a perceptually-driven color model that aligns more closely with how humans intuitively describe color, separating color information from brightness.
- The CIE Chromaticity Diagram is a device-independent standard that maps all colors visible to the average human eye, providing a universal reference for color measurement and communication.
The RGB Color Model: The Building Blocks of Digital Displays
Understanding Additive Color Synthesis
The RGB (Red, Green, Blue) color model is an additive color model, meaning that various proportions of red, green, and blue light are combined to produce a broad spectrum of colors. This model is based on the trichromatic theory of human color vision, which posits that the human eye perceives color through three types of cone cells, each sensitive to different wavelengths of light corresponding roughly to red, green, and blue. When red, green, and blue light are projected onto a screen, they mix additively, creating other colors. For example, combining red and green light produces yellow, red and blue light yield magenta, and green and blue light create cyan. When all three colors are mixed at their full intensity, they produce white light. Conversely, the absence of all three colors results in black.
Operational Principles of RGB
In digital systems, RGB colors are typically represented by three numerical values, often ranging from 0 to 255 for each component (Red, Green, Blue). This means that each primary color can have 256 different intensity levels, resulting in \(256 \times 256 \times 256 = 16,777,216\) possible colors. For instance:
rgb(255, 0, 0)represents pure red.rgb(0, 255, 0)represents pure green.rgb(0, 0, 255)represents pure blue.rgb(255, 255, 255)represents white.rgb(0, 0, 0)represents black.
This additive nature makes RGB ideal for electronic displays like televisions, computer monitors, and smartphones, where colors are generated by emitting light. The diagonal line connecting black (0,0,0) and white (1,1,1) in the RGB color cube represents various shades of gray, often referred to as the gray axis.

A visual representation of the RGB color model showing how red, green, and blue light combine additively to produce other colors.
Applications and Limitations of RGB
The RGB color model is ubiquitous in computer graphics and digital imaging due due to its direct compatibility with display hardware. However, it is considered a device-dependent color model. This means that the exact color produced by a given RGB value can vary from one device to another because different displays have different phosphors or dyes and varying responses to individual color levels. This necessitates color management systems to ensure consistent color reproduction across different screens. While excellent for digital displays, RGB is not intuitive for human color selection or for print applications (which typically use CMYK, a subtractive model).
The HSV Color Model: Human-Centric Color Description
Aligning with Human Perception of Color Attributes
The HSV (Hue, Saturation, Value) color model, also known as HSB (Hue, Saturation, Brightness), is a cylindrical coordinate representation of colors that attempts to align more closely with human perception than the RGB model. Unlike RGB, which describes colors by mixing primary light components, HSV separates color information into three intuitive attributes: Hue, Saturation, and Value.
Components of HSV
- Hue (H): This component represents the pure color itself, such as red, green, yellow, or blue. It is typically expressed as an angle in degrees, ranging from 0° to 360°, where 0° (or 360°) is red, 120° is green, and 240° is blue. Think of hue as wrapping around a color wheel.
- Saturation (S): This describes the purity or intensity of the color. It indicates how much gray is in the color. A saturation of 100% (or 1) means the color is fully saturated and vibrant, while 0% (or 0) means it is a shade of gray, ranging from white to black.
- Value (V): Also known as Brightness, this component represents the lightness or darkness of the color. A value of 100% (or 1) is a fully bright color, while 0% (or 0) is black (regardless of hue or saturation).
The HSV model can be visualized as a cylinder or a cone. The hue circles around the central axis, saturation extends outwards from the axis to the cylinder's edge, and value runs along the central axis from bottom (black) to top (white/brightest color).
This video provides a visual demonstration of converting images from RGB to HSV and exploring the color information within the HSV model.
Advantages of HSV in Practice
The human-centric nature of HSV makes it particularly useful in various applications, especially in image processing and computer vision:
- Intuitive Color Selection: Designers often find HSV more intuitive for choosing and adjusting colors, as they can independently modify the color's tint (hue), vibrancy (saturation), and lightness (value) without affecting the other attributes.
- Image Analysis: In computer vision, HSV is often preferred over RGB for tasks like color detection, segmentation, and object tracking. This is because changes in lighting conditions (which affect the "Value" component) do not significantly alter the "Hue" and "Saturation" components, making color identification more robust. For example, detecting a red stop sign is easier in HSV, as varying light intensities (affecting V) won't drastically change its H and S values.
- Color Manipulation: Operations like adjusting the brightness or saturation of an image are straightforward in HSV, as these attributes are isolated. In RGB, such adjustments would require complex manipulations of all three channels.
Despite its advantages in human perception and image analysis, HSV is typically converted to RGB for display on electronic devices, as RGB remains the native color model for most hardware.
The CIE Chromaticity Diagram: The Universal Color Map
Mapping All Visible Colors to the Human Eye
The CIE (Commission Internationale de l'Éclairage) Chromaticity Diagram, specifically the CIE 1931 xy Chromaticity Diagram, is a landmark achievement in colorimetry. It is a device-independent standard that represents all colors visible to the average human eye. Created in 1931, it provides a universal, two-dimensional map of chromaticity, separating color information (hue and saturation) from luminance (brightness).
The Foundation: CIE XYZ Color Space
The CIE Chromaticity Diagram is derived from the CIE 1931 XYZ color space. This color space is based on the results of experiments that measured how much red, green, and blue primary lights observers needed to match a given monochromatic light. These experimental results led to the definition of three "color-matching functions," denoted as \(\bar{x}(\lambda)\), \(\bar{y}(\lambda)\), and \(\bar{z}(\lambda)\). These functions represent the spectral sensitivity of the standard observer's hypothetical XYZ primaries. The Y component in XYZ is specifically defined to correspond to the perceived luminance (brightness) of a color, while X and Z capture the chromaticity information.
The tristimulus values X, Y, and Z for a given color with spectral power distribution \(P(\lambda)\) are calculated by integrating the product of the spectral power distribution and the color-matching functions over the visible spectrum:
\[ \begin{align*} X &= k \int P(\lambda) \bar{x}(\lambda) d\lambda \\ Y &= k \int P(\lambda) \bar{y}(\lambda) d\lambda \\ Z &= k \int P(\lambda) \bar{z}(\lambda) d\lambda \end{align*} \]Where \(k\) is a scaling factor.
Constructing the Chromaticity Diagram
To create the two-dimensional chromaticity diagram, the x and y chromaticity coordinates are calculated from the X, Y, and Z tristimulus values using the following formulas:
\[ \begin{align*} x &= \frac{X}{X + Y + Z} \\ y &= \frac{Y}{X + Y + Z} \end{align*} \]The z coordinate is redundant since \(x + y + z = 1\), so \(z = 1 - x - y\). This projection normalizes the color information, effectively removing the brightness component and allowing all visible colors to be plotted on a 2D plane.
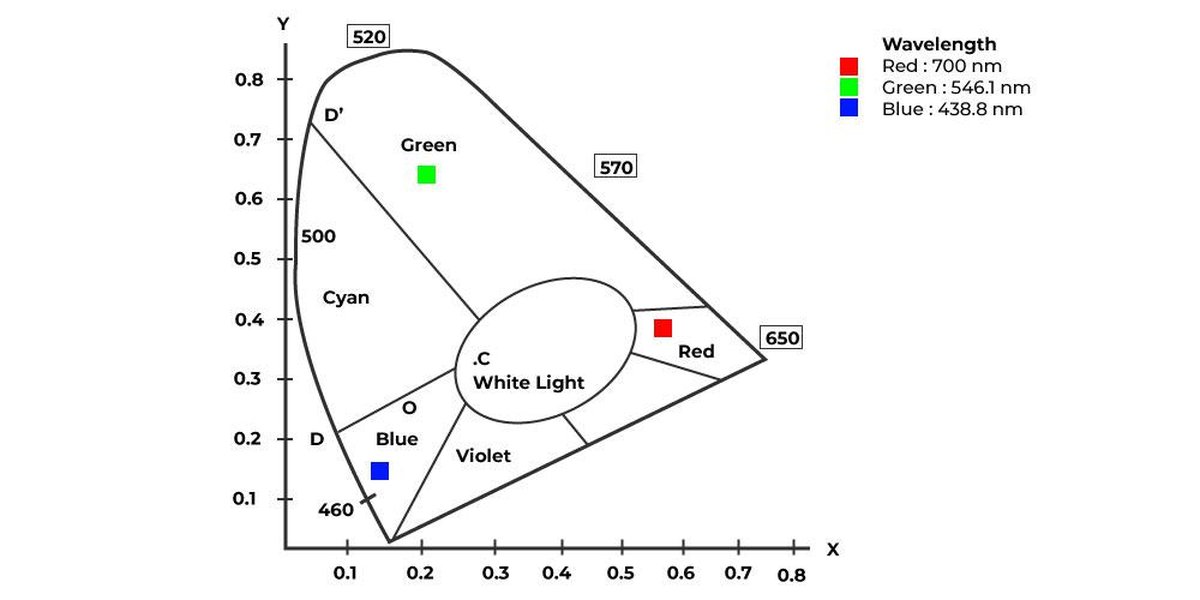
The horseshoe-shaped CIE 1931 chromaticity diagram, showing the spectral locus and various color gamuts.
Interpreting the Diagram
The CIE Chromaticity Diagram is a horseshoe-shaped curve, often called the "spectral locus," which represents all pure monochromatic (single-wavelength) colors. The straight line connecting the two ends of the horseshoe (from blue-violet to red) is known as the "purple line" or "line of purples," representing non-spectral colors that are mixtures of red and blue light. All colors perceivable by the average human eye are located within this horseshoe-shaped region.
- Hue: Corresponds to the direction from the central white point towards the perimeter.
- Saturation: Corresponds to the distance from the central white point; colors closer to the perimeter are more saturated (pure).
- White Point: The center of the diagram typically represents a white point (e.g., D65 for average daylight), which is an achromatic stimulus.
- Color Mixing: A straight line connecting any two points within the diagram represents all the colors that can be created by additively mixing those two colors. The resulting mixed color will lie on that line segment. If three colors are mixed, the resulting colors lie within the triangle formed by those three points. This concept is crucial for understanding color gamuts.
Significance and Applications
The CIE Chromaticity Diagram is invaluable for:
- Defining Color Gamuts: It allows the visual comparison of color gamuts (the range of colors a device can reproduce) for different technologies, such as RGB monitors, CMYK printers, and various display standards (e.g., sRGB, Adobe RGB, Rec. 2020). A larger area within the diagram indicates a wider gamut.
- Color Measurement and Specification: It provides a standardized system for objectively measuring and specifying colors, independent of the device used to display or capture them.
- Lighting and Display Technology: Used in the design and evaluation of lighting sources and display technologies to ensure accurate color reproduction and perceived quality.
- Color Difference Calculation: Later versions, like the CIE 1976 u'v' diagram, were developed to make color differences more perceptually uniform, allowing color differences to be computed as Euclidean distances.
Comparative Analysis of Color Models
Strengths and Weaknesses Across Applications
Each color model serves a specific purpose and excels in particular applications. Understanding their differences is key to choosing the most appropriate model for a given task. Here’s a comparative overview:
| Feature | RGB Color Model | HSV Color Model | CIE Chromaticity Diagram |
|---|---|---|---|
| Primary Use | Digital displays (monitors, TVs, cameras), electronic systems. | Image processing, computer vision, artistic color selection. | Standardized color measurement, gamut definition, universal color reference. |
| Model Type | Additive (light-based). | Perceptual (hue, saturation, value). | Device-independent chromaticity map. |
| Components | Red (R), Green (G), Blue (B) intensities. | Hue (H), Saturation (S), Value (V). | x (chromaticity coordinate), y (chromaticity coordinate), derived from XYZ tristimulus values. |
| Intuition | Less intuitive for human color selection. | Highly intuitive, mimics human color description. | Visualizes all perceivable colors, objective. |
| Device Dependence | Device-dependent (color appearance varies across displays). | Derived from RGB, thus indirectly device-dependent, but more robust to lighting variations. | Device-independent standard, provides a universal reference. |
| Color Mixing | Mixing light components additively. | Not directly designed for additive mixing of components, but for intuitive adjustment. | Linear mixing of colors on the diagram. |
| Example Application | Web design, digital photography, video editing. | Color segmentation in robotics, image enhancement software. | Quality control in manufacturing, display calibration. |
While RGB is the workhorse for digital displays, HSV offers a more human-friendly way to interact with color, and the CIE Chromaticity Diagram provides the scientific backbone for understanding and standardizing color perception and reproduction.
Radar Chart: Evaluating Color Model Utility
A Multidimensional Look at Strengths
To further illustrate the distinct advantages of each color model across various criteria, let's visualize their utility using a radar chart. This chart will highlight how each model performs in areas such as "Human Intuition," "Device Compatibility," "Image Analysis Efficiency," "Color Gamut Representation," and "Standardization." The scores are relative and represent a qualitative assessment of their strengths in practical applications.
As depicted in the radar chart, the RGB model excels in device compatibility, being the native language of most digital displays. The HSV model shines in human intuition and image analysis efficiency, making it preferred for color selection and object detection. The CIE Chromaticity Diagram, on the other hand, stands out for its strong standardization and comprehensive color gamut representation, serving as a fundamental tool for color science and engineering. Each model offers unique advantages, contributing to a holistic understanding and manipulation of color in various technological and perceptual contexts.
Frequently Asked Questions (FAQ)
Conclusion: The Diverse Landscape of Color Representation
The RGB, HSV, and CIE color models represent distinct yet complementary approaches to understanding and managing color. The RGB model, an additive system, forms the backbone of digital displays, leveraging the fundamental principle of mixing red, green, and blue light. The HSV model, with its intuitive hue, saturation, and value components, offers a human-centric alternative, simplifying color selection and enhancing image analysis in computer vision. Finally, the CIE Chromaticity Diagram stands as a universal, device-independent standard, mapping the entire spectrum of human-perceivable colors and serving as a critical tool for scientific measurement, standardization, and gamut comparison. Together, these models provide a comprehensive framework for creating, interpreting, and reproducing the rich tapestry of colors that surround us, bridging the gap between physical light, digital representation, and human perception.
Recommended Further Exploration
- How is CMYK different from RGB and when is it used?
- What are color gamuts and why are they important in display technology?
- Explain the concept of color management systems in digital workflows.
- How does the human eye perceive color, and what is trichromacy?
Referenced Search Results
 photo.stackexchange.com