
Unlocking Salesforce Insights: A Deep Dive into Event Monitoring Event Types
Discover the specific user actions, system processes, and security signals you can track within your Salesforce organization.
Salesforce Event Monitoring offers a powerful lens into the inner workings of your Salesforce environment. By capturing detailed logs of user activities and system events, it allows administrators and security teams to understand usage patterns, optimize performance, troubleshoot issues, and crucially, enhance security posture. Understanding the specific types of events you can monitor is key to leveraging this tool effectively.
Highlights: Key Insights into Salesforce Event Monitoring
- Comprehensive Coverage: Salesforce provides access to at least 50 distinct event types, covering a wide spectrum of activities from user logins and UI interactions to API calls and Apex code execution.
- Multi-faceted Benefits: Monitoring these events enables organizations to detect security threats (like unauthorized access or data exfiltration), optimize application performance, ensure user adoption, and maintain compliance.
- Flexible Access: Event log data, stored in the `EventLogFile` object, can be accessed via APIs (REST/SOAP), specialized tools like the Event Monitoring Analytics App, or downloaded directly for analysis.
Why Monitor Events in Salesforce?
Before diving into the specific event types, it's helpful to understand the core reasons organizations utilize Salesforce Event Monitoring. Monitoring provides critical visibility, enabling:
- Enhanced Security: Identify suspicious activities like multiple failed login attempts, unusual data exports, or potential session hijacking attempts in near real-time or through historical analysis.
- Performance Optimization: Pinpoint performance bottlenecks by analyzing events related to Apex execution time, Visualforce page loads, and Lightning component interactions.
- Improved User Adoption: Understand how users interact with Salesforce features, identify areas where they struggle, and track the usage of new functionalities.
- Compliance and Auditing: Maintain detailed audit trails of user actions, data access, and configuration changes to meet internal policies and external regulatory requirements.
- Troubleshooting: Diagnose issues more effectively by correlating different event types to understand the sequence of actions leading to an error or unexpected behavior.
Categorizing the Spectrum: Salesforce Event Types Explained
Salesforce groups its numerous event types into logical categories, making it easier to focus on specific areas of interest. While Salesforce documentation confirms at least 50 event types exist, the following categories and examples represent the most commonly monitored and impactful ones discussed in technical resources.
Authentication and Session Management
These events track how users access your Salesforce org.
Key Event Types:
- Login: Records every login attempt (successful or failed), including source IP, browser, application, and login method. Essential for detecting brute-force attacks or unauthorized access attempts.
- Logout: Logs user logout actions, helping understand session durations and patterns.
- Login As: Tracks when an administrator uses the "Login As" feature, providing an audit trail for actions taken on behalf of another user.
- Credential Stuffing: Specifically designed to detect patterns indicative of automated credential stuffing attacks (repeated failed logins across multiple usernames).
- Session Hijacking: Monitors for signs that a user's session may have been compromised or taken over.
User Interface (UI) and User Experience (UX)
Monitor how users interact with the Salesforce interface across different experiences.
Key Event Types:
- URI (Salesforce Classic): Tracks page views and clicks within the Salesforce Classic interface. Useful for understanding navigation patterns in older org configurations.
- Lightning Events (General): A suite of events covering interactions within Lightning Experience and the Salesforce mobile app.
- Lightning Page View: Records details about page loads in Lightning, including load times.
- Lightning Interaction: Captures specific user actions like clicks, taps, and scrolls within Lightning components.
- Lightning Error: Logs errors encountered by users within the Lightning interface, aiding in troubleshooting UI bugs.
- Lightning Performance: Provides detailed performance metrics for Lightning pages and components.
- Visualforce Request: Monitors requests and load times for Visualforce pages, helping optimize custom UI performance.
- Search: Tracks user search queries and interactions with search results.
Data Access, Reporting, and List Views
Understand how users view, export, and interact with data.
Key Event Types:
- Report: Logs when users run, view, or interact with reports.
- Report Export: Specifically tracks when users export report data, including the format. Critical for monitoring potential data exfiltration.
- ListView: Records interactions with list views, such as filtering, sorting, or viewing specific list views.
- Insufficient Access: Logs instances where a user attempted to access a record or resource they didn't have permission for.
API and Integration Activity
Monitor how external systems and integrations interact with your Salesforce data via APIs.
Key Event Types:
- API: General event type logging overall API usage (REST, SOAP, Bulk, etc.), tracking total calls and potential limit usage. `ApiEventStream` is often used for real-time monitoring.
- REST API: Details specific incoming REST API requests made to your org.
- SOAP API: Tracks incoming SOAP API requests.
- Bulk API: Monitors jobs submitted via the Bulk API (v1 or v2) for large data loads or extracts. `BulkApiResultEvent` provides details on job outcomes.
- Apex Callout: Records outbound API calls made from Apex code to external services.
- Metadata API Operation: Logs operations performed via the Metadata API, such as deploying changes or retrieving metadata.
Apex, Custom Code, and Flow Execution
Gain insights into the execution of your custom logic and automation.
Key Event Types:
- Apex Execution: Records details about Apex code executions (e.g., from triggers, controllers, batch jobs), including CPU time, DB time, and errors. Crucial for performance tuning.
- Apex Trigger: Logs the execution of Apex triggers in response to DML operations.
- Apex Unexpected Exception: Captures unhandled exceptions occurring in Apex code.
- Flow Execution: Provides data on Screen Flows, Autolaunched Flows, and other flow types, including execution times and errors.
- Time-Based Workflow: Monitors events related to legacy time-based workflow rules.
Security and Platform Integrity
Track events specifically related to platform security configurations and potential vulnerabilities.
Key Event Types:
- Insecure External Assets: Identifies when Visualforce pages or other components attempt to load resources (images, scripts) over insecure HTTP protocols.
- Platform Events: Monitors the publishing and delivery of standard and custom Platform Events used for real-time integration and notifications.
- Group Membership: Tracks changes to membership in public groups and queues.
- Sandbox: Captures events related to sandbox creation, refresh, and deletion operations.
Relative Focus on Event Categories: Organizational Priorities
The importance placed on monitoring different event categories can vary depending on an organization's size, industry, and specific challenges. The following chart provides a conceptual representation of how different types of organizations might prioritize their focus across key Event Monitoring use cases. Note that this is illustrative and actual priorities will differ.
As shown, highly regulated industries often place maximum emphasis on Security Monitoring and Data Access Compliance, while large enterprises tend to have high focus across most areas due to complexity. Smaller businesses might prioritize understanding user behavior alongside security basics.
Visualizing the Structure: Event Monitoring Categories
This mind map provides a simplified visual overview of the main categories and some example event types within Salesforce Event Monitoring.
(Page View, Interaction,
Error, Performance)"] ["Visualforce Request"] ["Search"] ["Data Access & Reporting"] ["Report (View/Run)"] ["Report Export"] ["ListView"] ["Insufficient Access"] ["API & Integration"] ["API (General)"] ["REST API"] ["SOAP API"] ["Bulk API"] ["Apex Callout"] ["Metadata API"] ["Apex & Custom Code"] ["Apex Execution"] ["Apex Trigger"] ["Flow Execution"] ["Security & Integrity"] ["Session Hijacking"] ["Insecure External Assets"] ["Group Membership"] ["Platform Events"]
Key Event Types Summary Table
This table summarizes some of the most frequently used event types and their primary purpose:
| Event Type | Category | Description | Common Use Case |
|---|---|---|---|
| Login | Authentication | Tracks user login attempts (success/failure). | Detecting unauthorized access, brute-force attacks. |
| Report Export | Data Access | Logs when users export data from reports. | Monitoring for potential data exfiltration. |
| API | API/Integration | Tracks overall API usage across different API types. | Monitoring integration health, enforcing API limits. |
| Apex Execution | Apex/Code | Records details of Apex code execution. | Debugging code, optimizing performance, identifying long-running processes. |
| Lightning Performance | UI/UX | Measures performance metrics for Lightning pages/components. | Identifying and resolving UI slowness issues. |
| URI / Lightning Interaction | UI/UX | Tracks user clicks and navigation within the UI. | Understanding user behavior, assessing feature adoption. |
| Flow Execution | Automation | Logs details about flow executions. | Troubleshooting flow errors, monitoring automation performance. |
| Credential Stuffing | Authentication/Security | Detects patterns suggesting automated login attacks. | Proactive threat detection against compromised credentials. |
| Insufficient Access | Data Access/Security | Logs attempts to access restricted data/features. | Auditing permission sets, identifying configuration issues. |
Visualizing Event Monitoring Data
While event logs provide raw data, visualizing this information is crucial for deriving actionable insights. Salesforce offers tools like the Event Monitoring Analytics App, and data can also be exported to external SIEM (Security Information and Event Management) systems or business intelligence platforms. The image below conceptually represents downloading event log files, which is the first step towards analysis and visualization.
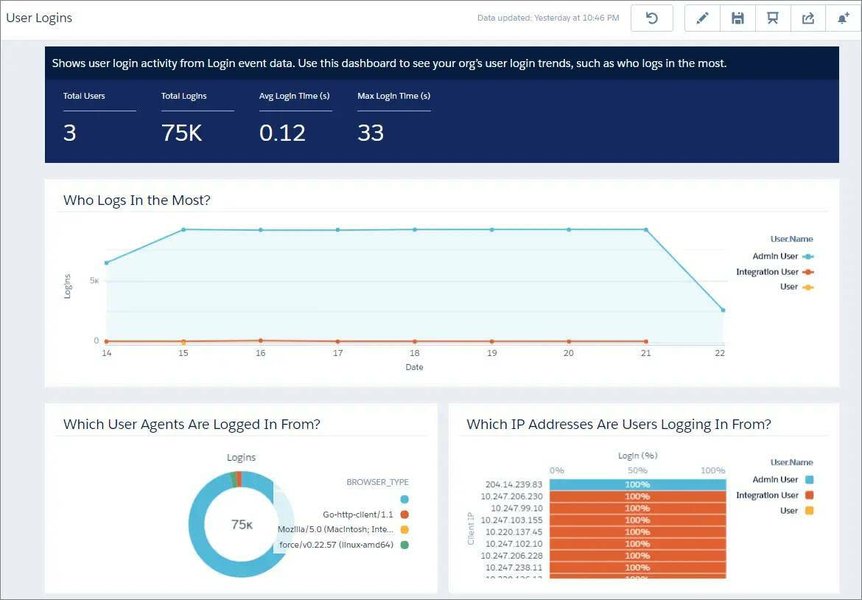
These downloaded files (typically in .csv format) contain detailed records for each event occurrence within a specific timeframe (usually hourly or daily). Analyzing these files involves parsing the data, aggregating metrics, and creating dashboards or reports to highlight trends, anomalies, and specific incidents related to security, performance, or user activity.
Understanding Performance and Adoption through Event Monitoring
Event Monitoring isn't just about security; it's a vital tool for understanding how your Salesforce applications are performing and how users are adopting features. By analyzing events like Lightning Page View, Lightning Performance, and Apex Execution, you can identify slow-loading pages or resource-intensive code. Similarly, tracking URI and Lightning Interaction events helps gauge user engagement with specific features or processes.
The video above provides insights into how Salesforce Event Monitoring delivers data on user interactions, app performance, and security details through event log files. It highlights how this data can be leveraged to gain a deeper understanding of both system health and user adoption patterns, enabling administrators to make data-driven decisions for optimization and improvement.
Accessing and Utilizing Event Log Data
Event log data is primarily stored within the `EventLogFile` object in Salesforce. You can access this data through several methods:
- API Queries: Use SOQL queries via the REST or SOAP API to retrieve specific `EventLogFile` records based on criteria like `EventType` and `LogDate`.
- Event Monitoring Analytics App: A dedicated Salesforce app (often requiring an additional license) that provides pre-built dashboards and datasets for visualizing event data directly within Salesforce.
- Direct Download: Administrators can manually download event log files from the Salesforce Setup menu.
- Third-Party Tools: Integrate with SIEM tools (like Splunk, LogRhythm) or data analysis platforms that have connectors for Salesforce event logs.
Data Retention: It's important to note the retention period for event log files. For organizations with the paid Event Monitoring add-on (often part of Salesforce Shield), logs are typically retained for 30 days. For Developer Edition orgs, retention is usually only 1 day. Real-Time Event Monitoring streams, which cover a subset of events, may have different retention policies, sometimes up to 6 months.
Frequently Asked Questions (FAQ)
How many event types are available in Salesforce Event Monitoring?
Is Event Monitoring free?
How long is event log data stored?
What is Real-Time Event Monitoring?
How can I access Event Monitoring data?
References
- EventLogFile Supported Event Types - Salesforce Developers
- Get Started with Event Monitoring | Salesforce Trailhead
- Salesforce Event Monitoring: Event Types - Titan
- Real-Time Event Monitoring - Salesforce Help
- Event Monitoring in Salesforce | Astrea IT Services
- Guide To Salesforce Shield Event Monitoring - OwnData
Recommended
Last updated April 11, 2025