
Integrating Scheduling Systems for Energy-Efficient Production
Exploring Mathematical Models, Graphs, and Tables for Optimized Manufacturing
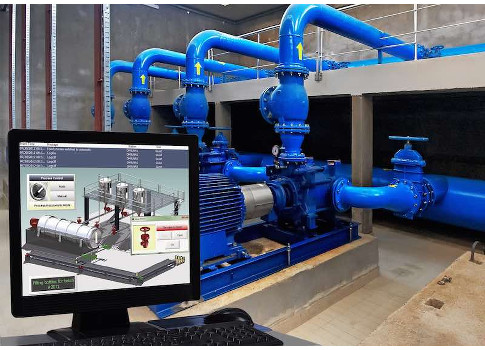
Key Highlights
- Advanced Mathematical Modeling: Utilizing linear programming, integer programming, and dynamic resource allocation to optimize energy use.
- Graphical Representation: Employing Gantt charts and flowcharts to visualize production schedules and decision-making processes.
- Data-Driven Analysis: Integrating detailed tables summarizing energy consumption, scheduling scenarios, and simulation results to compare efficiency metrics.
Introduction
The adoption of energy-efficient scheduling systems is becoming increasingly critical in the manufacturing and production sectors. In modern competitive environments, leveraging these systems not only reduces energy consumption and cost but also enhances sustainability and overall operational efficiency. This response synthesizes insights from various research fields, emphasizing mathematical models, graphical methods, and tabular data. The goal is to outline a comprehensive methodology suitable for a dissertation that addresses how scheduling systems can adapt production processes to fully utilize energy-efficient methodologies.
Mathematical Models for Energy-Aware Scheduling
Mathematical Framework and Modeling
Mathematical models form the backbone of energy-efficient scheduling. They are employed to capture real-world constraints such as machine availability, production deadlines, energy pricing, and capacity limitations. The use of linear programming, integer programming, and dynamic programming enables researchers to design optimization schemes that minimize energy consumption while maintaining production targets and quality.
Linear Programming and Mixed-Integer Linear Programming
Linear Programming (LP) techniques are used to formulate the problem where the goal is to minimize total energy consumption subject to various constraints. A common approach involves defining objective functions and constraints mathematically. For instance, consider the following simple formulation:
\( \text{Minimize:} \quad E = \sum_{i=1}^{n} e_i \cdot r_i \)
subject to:
\( P = \sum_{i=1}^{n} p_i \cdot r_i \) and \( R = \sum_{i=1}^{n} r_i \)
where \(e_i\) represents the energy consumption per unit of resource, \(p_i\) is the production output per unit, and \(r_i\) indicates the resources consumed. To incorporate discrete decision variables such as machine on/off statuses, Mixed-Integer Linear Programming (MILP) is typically used.
Dynamic Resource Allocation
Dynamic programming models allow for resource re-allocation in real-time based on the varying energy costs observed during the day. Energy prices often fluctuate, and scheduling production during off-peak hours can yield significant cost savings. For example, by defining a time-indexed variable \(x_{tm}\) indicating if a machine \(m\) is operational during time period \(t\), one can minimize the energy cost using the equation:
\( \text{Minimize:} \quad \sum_{t \in T} \sum_{m \in M} E_t \cdot x_{tm} \)
where \(E_t\) denotes the energy price at time \(t\). Sophisticated mathematical models like these help in scheduling operations dynamically, ensuring that production lines operate efficiently while using energy judiciously.
Graphical Representations in Scheduling Systems
Visualizing Production and Energy Consumption
Graphical representations play a pivotal role in understanding and communicating the intricacies of energy-efficient scheduling systems. These visual tools simplify the analysis and allow stakeholders to quickly grasp the performance dynamics and propose necessary adjustments.
Gantt Charts
Gantt charts are one of the most effective ways to represent production schedules over time. They can provide a detailed view of when machines are active, which periods see high energy usage, and opportunities where machines can be turned off without affecting production targets. In a dissertation, a Gantt chart might visually outline:
- Operation times for each machine.
- Intervals of high and low energy consumption.
- Scheduling blocks showing off-peak operations.
Color-coded charts can also highlight zones of peak energy pricing, allowing researchers to adjust scheduling algorithms accordingly.
Flowcharts
Flowcharts serve as an excellent tool to depict the decision-making process behind scheduling models. They trace the stages through which production planning moves—from data acquisition and analysis to model implementation and simulation-based verification. A typical flowchart may include:
- Initial data input and preprocessing.
- Assessment of energy consumption trends.
- Implementation of dynamic resource allocation algorithms.
- Final schedule generation and evaluation.
These visual representations simplify complexity and enhance the clarity of the dissertation's methodology.
Tabular Data for Comparative Analysis
Using Tables for Data Presentation
Tables are invaluable in summarizing quantitative data and comparing different scheduling scenarios in terms of energy efficiency. They allow the researcher to rapidly assess key performance metrics, such as energy consumption, production throughput, cost savings, and environmental impacts.
Energy Consumption Data Table
A sample table summarizing energy consumption across various machines might look like this:
| Machine ID | Energy Consumption (kWh) | Production Output (Units) |
|---|---|---|
| M1 | 100 | 500 |
| M2 | 80 | 400 |
| M3 | 120 | 600 |
Comparative Analysis of Scheduling Scenarios
Another crucial table is one that compares several scheduling scenarios under different operational strategies. For example:
| Scheduling Scenario | Total Energy Saved (%) | Cost Reduction (%) | CO2 Emissions Reduced (kg) |
|---|---|---|---|
| Baseline | 0 | 0 | 0 |
| Energy-Aware | 15 | 10 | 200 |
| Dynamic Allocation | 20 | 12 | 250 |
Such tabular representations allow for quick cross-comparisons of different methodologies, highlighting the most efficient algorithms and approaches.
Dissertation Methodology Framework
A Step-by-Step Structured Approach
In drafting a dissertation on the integration of scheduling systems for energy efficiency, it is critical to follow a step-by-step methodology that encapsulates comprehensive research methods. The framework outlined below integrates both theoretical and empirical components:
Step 1: Literature Review
Conduct a thorough literature review of existing research on energy-efficient scheduling systems. Focus on key publications that discuss various mathematical models, empirical studies, and case studies. This review forms the theoretical foundation and identifies gaps that your research aims to address.
Step 2: Data Collection and Analysis
Collect essential data on production processes, machine usage, energy consumption patterns, and time-dependent energy prices. This phase may include gathering historical data from ERP systems, sensor data from production equipment, or simulation-generated outputs. Tables and graphs can be instrumental in this data analysis phase.
Step 3: Model Development and Simulation
Develop mathematical models that represent the production process and energy consumption metrics. Using LP, MILP, and dynamic programming approaches, formulate optimization problems designed to minimize energy consumption while achieving production targets. Simulate these models under various scenarios—including baseline, energy-aware, and dynamic allocation—to generate comparative data.
Step 4: Graphical and Tabular Visualization
Once the simulation runs are complete, utilize Gantt charts, flowcharts, and tables to represent the results. Graphs should capture production schedules and energy consumption trends, while tables facilitate a side-by-side analysis of metrics such as energy saved, cost reductions, and environmental benefits.
Step 5: Statistical Analysis and Validation
Complement the mathematical model results with statistical analyses to validate the effectiveness of the proposed scheduling methods. Use statistical measures such as confidence intervals, standard deviations, and performance metrics like overall equipment effectiveness (OEE) to reinforce the reliability of the findings.
Step 6: Discussion of Practical Implications
Finally, discuss the practical implications of your findings. Evaluate how energy-efficient scheduling could reduce operational costs, lower environmental impact through reduced CO2 emissions, and contribute to sustainable production practices. Compare these results with traditional methods to underline the benefits.
Additional Tools and Considerations
Complementary Approaches in Dissertation Research
Beyond mathematical models and visual tools, it is beneficial to incorporate simulation software and programming code to implement and test scheduling algorithms. Tools like MATLAB, Python with optimization libraries, or specialized manufacturing simulation software can offer practical insights into the real-time operational challenges of energy-efficient scheduling.
Including code blocks in your appendix or supplementary material might be useful to illustrate the optimization routine or validate your mathematical models. For example, a Python code snippet using a linear programming solver might be provided to demonstrate how scheduling variables are managed.
Example Code Snippet
# Define energy consumption and production parameters
# Calculate optimal resource allocation using an LP solver

# This code block illustrates optimization for scheduling
import pulp

# Define problem: Minimizing energy consumption
problem = pulp.LpProblem("Energy_Optimization", pulp.LpMinimize)

# Define variables and parameters (example)
# Each machine's energy consumption and production output would be defined here
The code serves as an additional layer of transparency and repeatability in your research methodology.
Summary of Integrated Elements
Overview of the Comprehensive Methodology
Integrating scheduling systems into energy-efficient production methods requires a multilayered approach that combines advanced mathematical models, detailed graphical representations, and structured tabular analyses. The methodology involves:
- Developing optimization models using LP, MILP, and dynamic programming to achieve energy savings.
- Visualizing production schedules and energy consumption patterns with Gantt charts and flowcharts.
- Utilizing tables to communicate simulation outcomes, comparative performance metrics, and statistical validations.
- Incorporating simulation and code for practical demonstration and reproducibility of results.
This integrated methodology not only addresses the theoretical aspects of energy-efficient scheduling but also provides empirical evidence of its benefits, demonstrating its applicability in real-world manufacturing systems.
References
- Energy-efficient Scheduling - Springer
-
Machine on/off Control - ScienceDirect
- Sustainable Scheduling - MDPI
-
Energy Aware Scheduling - ScienceDirect
- Dynamic Scheduling - ArXiv
Recommended Related Queries
Last updated March 13, 2025