
Unlocking Semiconductor Secrets: A Guide to Photoluminescence and CLTM Characterization
Exploring optical and electrical techniques to understand semiconductor materials and contacts.
Semiconductors form the backbone of modern electronics. Understanding their intricate properties is crucial for developing efficient and reliable devices, from LEDs and solar cells to transistors and integrated circuits. Two powerful techniques, Photoluminescence (PL) spectroscopy and the Circular Transmission Line Model (CLTM), provide complementary insights into the optical, electronic, and interface characteristics of these vital materials.
Key Insights
- Photoluminescence (PL) non-destructively probes a semiconductor's optical and electronic properties, including band structure, defects, impurities, and carrier dynamics, by analyzing light emitted after laser excitation.
- Circular Transmission Line Model (CLTM) is an electrical test method specifically designed to measure the quality of ohmic contacts, determining crucial parameters like specific contact resistivity (ρ_c) and sheet resistance (R_s).
- Graphical Analysis is essential for CLTM, where plotting total resistance against contact geometry allows for the extraction of contact and sheet resistance, often requiring correction factors for accuracy.
Illuminating Semiconductors: An Introduction to Photoluminescence (PL)
Seeing the Light: How PL Works
Photoluminescence (PL) is a widely used optical phenomenon leveraged to characterize the electronic and optical properties of semiconductors and other materials (Horiba - Photoluminescence of Semiconductors; Sciencedirect - Photoluminescence). It's a non-destructive, contactless, and relatively fast process, making it invaluable for analyzing materials at various fabrication stages (Wikipedia; Sciencedirect - Photoluminescence). The core principle involves shining light (usually from a laser) onto the semiconductor material with photon energy greater than its bandgap energy (\(E_g\)). This excitation promotes electrons from the lower energy valence band to the higher energy conduction band, leaving behind positively charged "holes" – effectively creating electron-hole pairs (Zurich Instruments; Ossila).
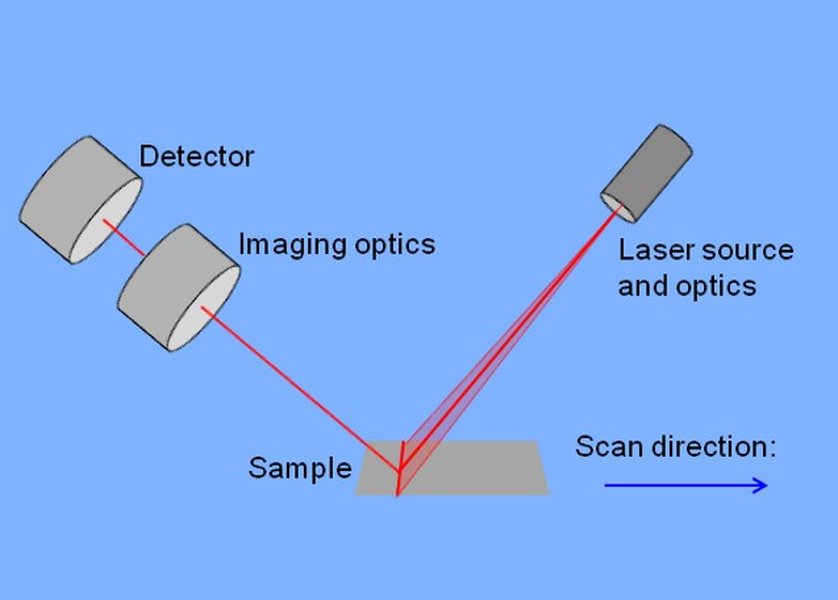
A typical setup for Photoluminescence Imaging (PLI), a related technique providing spatial maps of PL properties.
These excited electrons and holes eventually relax back to lower energy states. One way they release this excess energy is by emitting photons. This emitted light is the photoluminescence signal (Sciencedirect - Photoluminescence; Ossila). By carefully collecting and analyzing the spectrum of this emitted light – its intensity, wavelength (energy), and sometimes its decay over time – researchers gain profound insights into the material's fundamental characteristics (Zurich Instruments; Ossila).
What Can We Learn from PL?
PL spectroscopy is a versatile tool capable of revealing a wealth of information about semiconductor materials. Key parameters accessible through PL measurements include:
- Band Structure and Band Gap (Eg): The energy (wavelength) of the main emission peak often directly corresponds to the material's bandgap, especially for direct bandgap semiconductors. This is a fundamental property determining the material's optical absorption and emission characteristics (Zurich Instruments; Horiba - Photoluminescence of Semiconductors; Journal of Applied Physics).
- Material Composition: In semiconductor alloys (like AlGaAs or SiGe), the bandgap, and thus the PL peak position, shifts predictably with composition. Mathematical models can relate the PL spectrum to the precise elemental makeup (Horiba - Photoluminescence Measurement System).
- Purity and Crystalline Quality: The intensity and sharpness (narrowness) of the band-edge emission peak are strong indicators of material quality. High-quality crystals typically show bright, sharp peaks, while defects and impurities tend to broaden the peaks and introduce additional, lower-energy emissions (Wikipedia; Universiti Teknologi Malaysia; Journal of Applied Physics). PL is especially important for materials like GaN and InP (Wikipedia).
- Defects and Impurities: PL is highly sensitive to the presence of defects (like vacancies, interstitials, dislocations, stacking faults) and impurity atoms within the crystal lattice. These often create energy levels within the bandgap, leading to distinct emission peaks at energies lower than the bandgap emission. Identifying these peaks helps diagnose specific imperfections (Journal of Applied Physics; Horiba - Photoluminescence of Semiconductors; Springer Link; Ossila). It can detect trap states which affect carrier lifetimes (Ossila; Sciencedirect - Photoluminescence).
- Carrier Lifetimes: Using Time-Resolved Photoluminescence (TRPL), which measures how the PL intensity decays over time after a short excitation pulse, researchers can determine the average time an excited electron-hole pair exists before recombining (minority carrier lifetime). This is critical for device efficiency (Universiti Teknologi Malaysia; Journal of Physical Chemistry C; Wikipedia).
- Exciton Properties: In many semiconductors, especially at low temperatures, excited electrons and holes can bind together to form quasiparticles called excitons. PL can probe exciton binding energies and lifetimes (Universiti Teknologi Malaysia).
- Disorder: Variations in alloy composition or structural imperfections can lead to broadening of PL peaks, quantifying the degree of disorder (Wikipedia).
- Charge Carrier Dynamics: Analyzing PL intensity changes (e.g., quenching over time) can provide insights into how charge carriers move, relax, and are extracted from the material, which is crucial for solar cells and photodetectors (Ossila; Journal of Physical Chemistry C).
Why Use PL?
The advantages of PL include its non-destructive and contactless nature, meaning the sample isn't damaged or altered during measurement. It's also highly sensitive, capable of detecting even minute concentrations of impurities or defects (Ossila; Sciencedirect - Photoluminescence). Performing measurements at different temperatures (e.g., cryogenic temperatures like 4K) can further enhance spectral features by reducing thermal broadening, making subtle peaks easier to resolve (Andor.com).
Visualizing PL Information
The following video provides a great overview of the types of information that can be gleaned from analyzing photoluminescence spectra:
As the video explains, analyzing peak positions, intensities, widths (Full Width at Half Maximum - FWHM), and decay times allows scientists and engineers to assess material quality, identify specific impurities or defects, determine alloy compositions, measure fundamental properties like the bandgap, and understand charge carrier behavior crucial for device performance.
Measuring Contact Quality: The Circular Transmission Line Model (CLTM)
Making Contact: Why CLTM Matters
While PL reveals intrinsic material properties through light, the performance of semiconductor devices often hinges critically on the quality of the electrical contacts made to them. An ohmic contact is a metal-semiconductor junction that exhibits a linear current-voltage (I-V) relationship, allowing current to flow easily in both directions with minimal resistance. The Circular Transmission Line Model (CLTM) is a specialized electrical test structure and measurement technique used to precisely characterize these ohmic contacts (ResearchGate; TUE Research).
CLTM structures typically consist of a central circular contact pad surrounded by a ring-shaped contact, separated by a gap. Sometimes variations involve multiple concentric rings or patterns with varying gap spacings. By measuring the resistance between these contacts, specific properties of the metal-semiconductor interface and the underlying semiconductor layer can be extracted (ResearchGate; TUE Research).

Illustrative example related to patterning, conceptually similar to how CLTM structures are fabricated on wafers.
Key Parameters Determined by CLTM
CLTM measurements allow the determination of several critical parameters:
- Specific Contact Resistivity (ρc): This is the primary figure of merit for an ohmic contact, representing the intrinsic resistance per unit area of the metal-semiconductor interface (Units: Ω·cm²). A lower ρ_c indicates a higher quality contact with less voltage drop and power loss. It's a crucial parameter for predicting device performance and reliability (ResearchGate; TUE Research).
- Contact Resistance (Rc): This represents the resistance associated with current flowing from the metal contact into the semiconductor layer beneath it (Units: Ω). It depends on ρ_c as well as the contact geometry.
- Sheet Resistance (Rs): This parameter quantifies the resistance of the semiconductor layer itself, specifically for current flowing laterally within that layer (Units: Ω/square or Ω/□). It depends on the material's resistivity and the thickness of the conducting layer. Understanding R_s is essential for modeling current flow within the device (ResearchGate; TUE Research).
Graphical Analysis and Resistance Correction
Extracting these parameters typically involves a graphical method based on measurements across CLTM structures with different gap spacings (L or related geometric factors like radii). The total resistance (Rtotal) measured between two contacts in a TLM-like structure (including linear and circular variants) often follows a linear relationship with the spacing:
\[ R_{\text{total}} = 2R_c + R_s \times (\text{Geometric Factor}) \]In the simplest linear TLM case, the Geometric Factor is \( L/W \), where L is the gap length and W is the contact width (ResearchGate). For CLTM, the geometric factor is more complex, often involving logarithms of radii ratios (\(\ln(r_2/r_1)\)) or other functions depending on the exact geometry and current flow assumptions.
By plotting \(R_{\text{total}}\) measured for different spacings against the corresponding Geometric Factor, a straight line is ideally obtained. The key parameters can then be extracted:
- The y-intercept (where the Geometric Factor is zero) corresponds to \(2R_c\), allowing the Contact Resistance (\(R_c\)) to be determined.
- The slope of the line is related to the Sheet Resistance (\(R_s\)).
The Need for Correction Factors
In practice, measured data may deviate from the ideal linear relationship due to various factors, including non-uniform current flow, parasitic resistances, or inaccuracies in the defined geometry. To obtain accurate values, especially for ρ_c (which is derived from R_c and R_s), correction factors are often necessary (ResearchGate; TUE Research).
These correction factors, often calculated numerically based on the specific CLTM geometry (e.g., inner radius, outer radius, gap spacing), are applied to the measured resistance data before performing the linear fit and extrapolation (ResearchGate figure tbl1_282403092). They essentially adjust the raw data to better match the underlying theoretical model.
The table below shows an example concept (based on data described in ResearchGate figure tbl1_282403092) of how correction factors might vary with the geometry of a CLTM structure:
| Gap Spacing (µm) | Geometric Ratio (Example) | Calculated Correction Factor (Example) |
|---|---|---|
| 5 | 1.1 | 1.05 |
| 10 | 1.2 | 1.10 |
| 15 | 1.3 | 1.15 |
| 20 | 1.4 | 1.20 |
| 25 | 1.5 | 1.25 |
This table illustrates hypothetical correction factors for different gap spacings in a CLTM structure. Actual factors depend heavily on the precise dimensions and model used. Applying these factors adjusts the measured resistance values for more accurate parameter extraction.
Relevant CLTM Formulas
The fundamental formula used in the graphical analysis relates the total measured resistance to the contact resistance and sheet resistance via a geometric factor, as shown above:
\[ R_{\text{total}} = 2R_c + R_s \times (\text{Geometric Factor}) \]Deriving the specific contact resistivity (\(\rho_c\)) from the extracted \(R_c\) and \(R_s\) involves more complex formulas specific to the CLTM geometry. These often incorporate the transfer length (\(L_T = \sqrt{\rho_c / R_s}\)) and geometrical parameters like radii, potentially involving Bessel functions or numerical solutions (TUE Research; ResearchGate). While simple formulas like \(\rho_c = R_c^2 \times R_s\) are sometimes mentioned (Answer B), they may be oversimplifications or apply only under specific assumptions. Accurate determination usually relies on the full CLTM analysis incorporating the correct geometric dependencies and potentially the correction factors discussed earlier.
Comparing PL and CLTM: A Visual Analysis
Strengths and Focus Areas
Photoluminescence and CLTM offer complementary views of semiconductor materials and structures. PL excels at probing the intrinsic optical and electronic properties related to the semiconductor crystal itself (band structure, defects, recombination), while CLTM focuses specifically on the electrical quality of the crucial interface between the metal contact and the semiconductor. The radar chart below visualizes the relative strengths of each technique across different characterization aspects, based on typical applications.
This chart highlights PL's strength in assessing intrinsic material properties like band structure, defects, and carrier lifetimes non-destructively. Conversely, CLTM excels in providing specific, quantitative data about electrical contacts (Rc, ρc) and the semiconductor sheet resistance (Rs) near the contact, which directly impacts device function, though it requires dedicated test structures.
Mapping the Landscape of Semiconductor Characterization
Connecting PL and CLTM
Both Photoluminescence and CLTM are vital tools within the broader field of semiconductor characterization. They provide different but complementary pieces of the puzzle needed to understand and optimize semiconductor materials and devices. The mindmap below illustrates how these techniques fit into the overall characterization process and the key parameters they target.
This mindmap shows that both PL (under Optical Techniques) and CLTM (under Electrical Techniques for Contact Characterization) contribute to understanding fundamental material properties like electronic structure, defects, carrier behavior, and interface quality, ultimately enabling the development of better semiconductor devices.
Frequently Asked Questions (FAQ)
Why are PL measurements often done at low temperatures?
Lowering the temperature (e.g., to liquid helium temperature, 4K) reduces the thermal energy within the semiconductor lattice. This minimizes lattice vibrations (phonons) that can interact with electrons and holes, leading to several benefits for PL measurements:
- Sharper Spectral Features: Reduced thermal broadening results in narrower emission peaks, making it easier to resolve closely spaced peaks related to different transitions (e.g., free excitons vs. bound excitons vs. defect states).
- Increased Emission Intensity: Non-radiative recombination pathways (where energy is lost as heat instead of light) are often suppressed at low temperatures, increasing the overall PL intensity (quantum efficiency).
- Observation of Fine Structure: Subtle features related to specific impurities or defect complexes, which might be obscured by thermal broadening at room temperature, become observable.
(Reference: Andor.com, Journal of Applied Physics)
What defines a "good" ohmic contact, and why is low specific contact resistivity (ρc) important?
A good ohmic contact allows electrical current to flow easily between the metal and the semiconductor with minimal voltage drop, regardless of the current direction. Ideally, it behaves like a simple resistor with a linear current-voltage (I-V) characteristic passing through the origin.
Specific contact resistivity (ρc) is the key metric quantifying this "easiness" of current flow across the interface itself. A low ρc is crucial because:
- Reduces Power Loss: High contact resistance (which depends on ρc) leads to power dissipation (\(P = I^2R\)) at the contact, generating unwanted heat and reducing device efficiency.
- Minimizes Voltage Drop: A significant voltage drop across the contact reduces the voltage available for the active region of the device, impairing performance (e.g., lower output power in transistors, lower voltage in solar cells).
- Ensures Device Functionality: In many devices, particularly high-power or high-frequency ones, excessive contact resistance can severely limit performance or even prevent proper operation.
CLTM is specifically designed to accurately measure ρc, allowing engineers to optimize contact materials and fabrication processes. (Reference: ResearchGate, TUE Research)
Is CLTM considered a destructive measurement technique?
Yes, CLTM is generally considered a destructive technique in the sense that it requires the fabrication of specific test patterns (the circular contacts and gaps) directly onto the semiconductor wafer or sample. These test structures typically occupy space that could otherwise be used for functional devices.
While the electrical measurements themselves (passing current and measuring voltage) are usually non-damaging to the structure, the need to pattern and process these dedicated CLTM structures means it's not suitable for characterizing finished devices or materials intended for immediate use without further processing. It's primarily used during process development and for monitoring fabrication consistency on test wafers or in designated test areas on product wafers.
In contrast, PL is non-destructive as it only requires shining light on the sample. (Inferred from descriptions of PL as non-destructive and CLTM requiring fabricated structures).
References
- Photoluminescence of Semiconductors - HORIBA
- Photoluminescence Spectroscopy - Ossila
- Photoluminescence - Wikipedia
-
Photoluminescence | Zurich Instruments - Zurich Instruments
- Measurement and analysis of photoluminescence in GaN - Journal of Applied Physics (AIP)
- Two-contact Circular Test Structure for Determining Specific Contact Resistivity - ResearchGate
- Characterisation of ohmic contacts on n-InP and p-InGaAs based - TU/e Research Portal (PDF)
-
Photoluminescence - ScienceDirect Topics
-
Photoluminescence measurements on semiconductors - Andor Technology
- Calculated correction factors and contact resistance values for various gap spacing - ResearchGate (Figure/Table Reference)
Recommended
 d197for5662m48.cloudfront.net
Last updated April 19, 2025