
SonarQube Pipeline Timeouts: Unraveling the 20-Minute Mystery and Finding Solutions
Why your SonarQube analysis might be hitting a wall after 20 minutes and how to overcome it for smoother CI/CD.
Experiencing timeouts in your SonarQube analysis during CI/CD pipeline runs, especially around the 20-minute mark, is a common frustration. These interruptions can halt development workflows and delay releases. This comprehensive guide will help you understand the multifaceted reasons behind these timeouts and provide actionable strategies to diagnose and resolve them effectively.
Key Insights: Understanding SonarQube Timeouts
- Multiple Factors: Timeouts are rarely due to a single cause. They often stem from a combination of long analysis durations, network issues, resource limitations, and configuration settings.
- Configuration is Crucial: Default timeout settings in SonarQube, the CI/CD pipeline, or associated services (like databases or proxies) might be too short for your project's needs.
- Resource Allocation Matters: Insufficient CPU, memory, or I/O resources on the SonarQube server or the build agent can significantly slow down analysis, leading to timeouts.
Why Do SonarQube Pipelines Time Out Around 20 Minutes?
The "20-minute timeout" is a frequent occurrence because many CI/CD systems or intermediate components have default timeout values around this duration. When a SonarQube scan takes longer, it hits this predefined limit. Let's delve into the primary culprits:
Core Causes of SonarQube Timeouts
1. Extensive Analysis Duration
Larger or more complex codebases naturally require more time for SonarQube to analyze. If the analysis duration inherently exceeds the configured timeout limits of the pipeline job, SonarQube scanner, or quality gate checks, a timeout will occur.
- Large Projects: Analyzing millions of lines of code, especially with many active rules, can be time-consuming.
- Complex Code: Highly intricate code structures can increase processing demands.
2. Network and Connectivity Bottlenecks
Communication issues between the build agent (running the SonarScanner), the SonarQube server, and its database can lead to delays and timeouts.
- Firewalls and Proxies: Corporate firewalls (like Zscaler) or network proxies might block or slow down traffic to the SonarQube server, often on its default port (9000). This can interrupt connections.
- Database Connectivity: SonarQube relies heavily on its database. If connections between the SonarQube server and the database are slow, unstable, or subject to their own timeouts (e.g., idle connection timeouts in PostgreSQL), it can cause the analysis to hang and eventually time out.
- Plugin Downloads: The SonarScanner might need to download plugins. Slow or interrupted downloads due to network issues can contribute to timeouts.
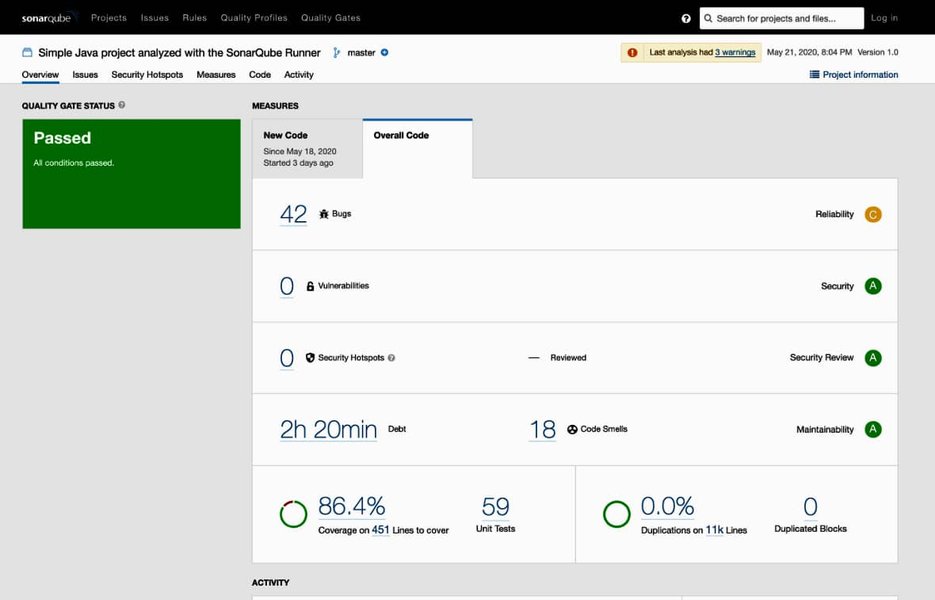
A typical SonarQube project dashboard displaying analysis results, which can be delayed by timeout issues.
3. Insufficient System Resources
Both the SonarQube server and the build agent running the scanner require adequate resources.
- SonarQube Server: Insufficient CPU, RAM, or slow disk I/O on the server hosting SonarQube can bottleneck the analysis process. This is especially true if the server hosts other applications or if SonarQube itself is processing multiple analyses concurrently.
- Build Agent: The machine executing the pipeline job and running the SonarScanner also needs enough resources. If the agent is resource-starved, the scan will perform poorly.
4. Configuration Missteps and Inadequate Settings
Incorrect or insufficient timeout configurations are a direct cause of these issues.
- SonarQube Timeouts: Settings like
sonar.qualitygate.timeout(for waiting on Quality Gate results),sonar.ws.timeout(web service communication), orsonar.scanner.timeoutmight be set too low. - Pipeline Job Timeouts: Most CI/CD platforms (e.g., Azure DevOps, GitLab, Jenkins) have their own job-level timeout settings. If a SonarQube scan exceeds this, the entire job will be terminated. A 20-minute default is common in some systems.
- Database Timeouts: Database connection pool settings (e.g., HikariCP used by SonarQube) or database-level timeouts might be too aggressive.
5. SonarQube Version and Plugin Issues
Older versions of SonarQube or its plugins might contain performance bugs or inefficiencies that have been resolved in newer releases. Keeping SonarQube and its components updated is crucial.
6. Transient Environmental Factors
Sometimes, timeouts can be due to temporary issues like network glitches, momentary high load on shared resources, or service outages. While less common for consistent 20-minute timeouts, they can be contributing factors.
Systematic Troubleshooting and Solutions
Addressing SonarQube timeouts requires a methodical approach. Start with diagnostics and then move to targeted solutions.
1. Deep Dive into Logs
Logs are your primary source of information for diagnosing timeouts:
- Pipeline Logs: Examine the logs of the failing CI/CD pipeline job. Look for specific error messages related to SonarQube steps, connection issues, or timeout notifications. Platforms like Azure DevOps allow downloading comprehensive logs.
- SonarScanner Logs: Run the SonarScanner with increased verbosity (e.g.,
sonar-scanner -Xor-Dsonar.verbose=true). This provides detailed information about each step of the analysis, including plugin downloads, sensor execution times, and communication with the SonarQube server. - SonarQube Server Logs: Check the logs on the SonarQube server itself (typically
sonar.log,web.log,ce.log,es.log). These can reveal issues with database connections, resource exhaustion, or internal server errors.
2. Adjust Timeout Configurations
Often, simply increasing timeout values can provide immediate relief, but it's important to understand if this is masking a deeper issue.
Key Timeout Parameters to Review
The following table summarizes important timeout settings and where they are typically configured. Adjust these values cautiously, increasing them incrementally.
| Parameter | Purpose | Typical Configuration Location | Example Adjustment |
|---|---|---|---|
sonar.qualitygate.timeout |
Max time (seconds) scanner waits for Quality Gate computation. | SonarScanner analysis parameters | -Dsonar.qualitygate.timeout=900 (15 mins) or higher |
sonar.ws.timeout / sonar.web.http.keepAliveTimeout |
Timeout for web service calls to SonarQube server. | SonarQube server sonar.properties or scanner parameters |
Increase as needed (e.g., 600000 ms = 10 mins) |
sonar.scanner.timeout |
General timeout for scanner operations (replaces older HTTP timeouts). | SonarScanner analysis parameters | Adjust based on typical scan duration |
| Pipeline Job Timeout | Maximum execution time for the entire CI/CD job. | CI/CD platform settings (e.g., Azure DevOps YAML, GitLab CI config) | Increase from default (e.g., to 30, 60 minutes, or 0 for unlimited in some systems) |
| Database Connection/Statement Timeouts | Timeouts related to database operations. | SonarQube sonar.properties (for HikariCP pool) and/or database server configuration (e.g., PostgreSQL statement_timeout) |
Increase carefully, align with expected query times. SonarSource sometimes recommends customizing HikariCP settings to their defaults. |
3. Optimize Resources and Performance
Enhance Server and Agent Capabilities
- SonarQube Server: Monitor CPU, memory, and disk I/O on the SonarQube server during analysis. If resources are consistently high, consider upgrading hardware, allocating more resources (if virtualized), or ensuring SonarQube is running on a dedicated machine. Regularly restarting the SonarQube server (e.g., weekly) can sometimes improve stability.
- Build Agent: Ensure the build agent has sufficient resources. If using containerized agents, ensure their resource limits are adequate.
Streamline the Analysis Process
- Reduce Scope:
- Exclude unnecessary files and directories (e.g.,
sonar.exclusions,sonar.test.exclusions). This can include generated code, third-party libraries, or large media files. - Break down very large monolithic projects into smaller, independently scannable modules if feasible.
- Exclude unnecessary files and directories (e.g.,
- Incremental Analysis: Where supported, use incremental analysis to scan only changed code, significantly speeding up subsequent scans.
- Rule Optimization: Review active SonarQube rules. Disabling very resource-intensive or less critical rules can reduce analysis time, especially for large projects.
4. Address Network and Connectivity Issues
- Firewall/Proxy Configuration: Verify that firewalls or proxies are not interfering. Ensure the SonarQube server port (default 9000) is open for communication from build agents. If Zscaler or similar tools are suspected of blocking traffic, consider changing SonarQube's web port (e.g., to 9090 in
sonar.propertiesviasonar.web.port) and updating scanner configurations. - Database Network: Ensure robust and low-latency connectivity between the SonarQube server and its database.
5. Upgrade SonarQube and Scanners
Ensure you are running a recent, stable version of the SonarQube server, SonarScanner, and any relevant build system plugins (e.g., for Maven, Gradle, .NET). Newer versions often include performance improvements and bug fixes related to timeouts.
6. Implement Retry Mechanisms
For transient issues, configuring retry mechanisms in your CI/CD pipeline for the SonarQube analysis step can be helpful. Some platforms offer built-in retry capabilities for failed tasks.
Visualizing Timeout Influencing Factors
The following chart provides an opinionated view on how various factors might contribute to SonarQube timeout issues. A higher score indicates a greater potential impact on causing timeouts if not managed correctly. This can help prioritize areas for investigation.
This chart suggests that while Codebase Size/Complexity and SonarQube Timeout Configurations have a high potential impact, adjusting configurations might be more straightforward than refactoring a large codebase. Outdated versions are impactful but typically easier to mitigate via upgrades.
Troubleshooting Workflow Mindmap
This mindmap outlines a structured approach to diagnosing and resolving SonarQube pipeline timeouts, connecting potential causes to diagnostic steps and solutions.
General Pipeline Troubleshooting Tips
Understanding general pipeline troubleshooting can be very beneficial when dealing with specific issues like SonarQube timeouts. The following video offers tips, tools, and techniques applicable to various pipeline problems:
This video, "Troubleshooting Pipelines- Tips, Tools, and Techniques," covers broader strategies for diagnosing why pipelines fail, which can complement the SonarQube-specific advice. It emphasizes looking at logs, understanding dependencies, and isolating problems – all relevant when your SonarQube step is the point of failure within a larger CI/CD process.
Frequently Asked Questions (FAQ)
Recommended Next Steps
To deepen your understanding or explore related areas, consider these queries:
- How to optimize SonarQube server performance for large projects?
- Best practices for configuring SonarQube in Azure DevOps pipelines?
- Troubleshooting SonarQube database connection pool issues?
- Advanced SonarScanner parameters for fine-tuning analysis?
References
 docs.aws.amazon.com
Last updated May 12, 2025