
Empowering Support Engineers with Browser Developer Tools: A Deep Dive
Unlocking Advanced Troubleshooting and Real-time Problem Solving
Key Insights into Browser Developer Tools for Support Engineers
- Real-time Debugging: Browser developer tools allow support engineers to inspect and modify HTML, CSS, and JavaScript in real time, enabling immediate identification and resolution of front-end issues without needing to reload the page or change source code.
- Comprehensive Diagnostics: These tools offer a holistic view of a webpage's performance, network activity, and console errors, providing support engineers with crucial data to diagnose complex problems that might otherwise be invisible.
- Enhanced Collaboration and Communication: By being able to precisely identify and demonstrate issues within the browser environment, support engineers can communicate more effectively with development teams, streamlining the bug reporting and resolution process.
The Indispensable Role of Browser Developer Tools for Support Engineers
Browser developer tools, often simply referred to as "DevTools," are integrated suites of tools found within modern web browsers such as Chrome, Firefox, and Edge. While primarily designed for web developers, these powerful utilities offer an indispensable toolkit for support engineers. Their ability to provide real-time insights into a webpage's structure, performance, and behavior makes them critical for effective troubleshooting, diagnosis, and communication in a support role. Support engineers frequently encounter user-reported issues that manifest on the client-side, and without the granular control and visibility offered by DevTools, resolving such problems would be significantly more challenging and time-consuming.
Understanding Developer Support Engineering
A Developer Support Engineer is a hybrid role that blends technical support with software development skills. Unlike traditional support roles that might focus solely on customer queries and basic debugging, a Developer Support Engineer actively assists developers who utilize a company's software, APIs, or platforms. This often involves debugging complex issues, analyzing system behavior, and sometimes even developing internal tools or scripts to aid in support processes. Their work requires a deep understanding of the underlying technology and the ability to bridge the gap between end-users (often other developers) and the core development teams. Tools like GitHub, GitLab, Vault, and Artifactory are commonly administered and supported by these engineers, alongside CI/CD workflows.
Why Browser DevTools are Crucial for Support Engineers
For support engineers, especially those in developer support roles, browser developer tools are not just a convenience but a necessity. They provide the means to:
- Inspect Live Web Content: Gain immediate access to the rendered HTML, CSS, and JavaScript of a webpage. This is crucial because the rendered code can differ significantly from the source code if JavaScript dynamically modifies the page.
- Debug Client-Side Issues: Troubleshoot problems that occur within the user's browser, such as layout inconsistencies, unresponsive elements, or JavaScript errors.
- Analyze Network Activity: Monitor all HTTP traffic, including requests, responses, headers, and loading times, which is essential for diagnosing issues related to API calls, resource loading, or server communication.
- Evaluate Performance: Measure page load times, identify performance bottlenecks, and understand how different elements affect the user experience.
- Simulate Environments: Test website behavior across various screen sizes and device types using built-in device emulation modes, helping to pinpoint responsive design issues.
Core Capabilities of Browser Developer Tools
Modern browser developer tools are packed with a wide array of features, each serving a distinct purpose in web development and, by extension, support engineering. Mastering these features allows support engineers to quickly pinpoint and diagnose issues.
The Elements Panel: Inspecting and Modifying HTML and CSS
The Elements panel is arguably the most frequently used tool for support engineers. It displays the page's rendered HTML structure, allowing engineers to see exactly how the page is constructed in the browser. Alongside the HTML, the Styles tab within the Elements panel shows all the CSS rules applied to a selected element. This real-time visibility enables support engineers to:
- Identify missing or misplaced HTML elements.
- Debug CSS issues such as incorrect styling, layout shifts, or responsive design problems.
- Experiment with CSS property changes on the fly to test potential fixes or demonstrate ideal behavior without altering the source code.
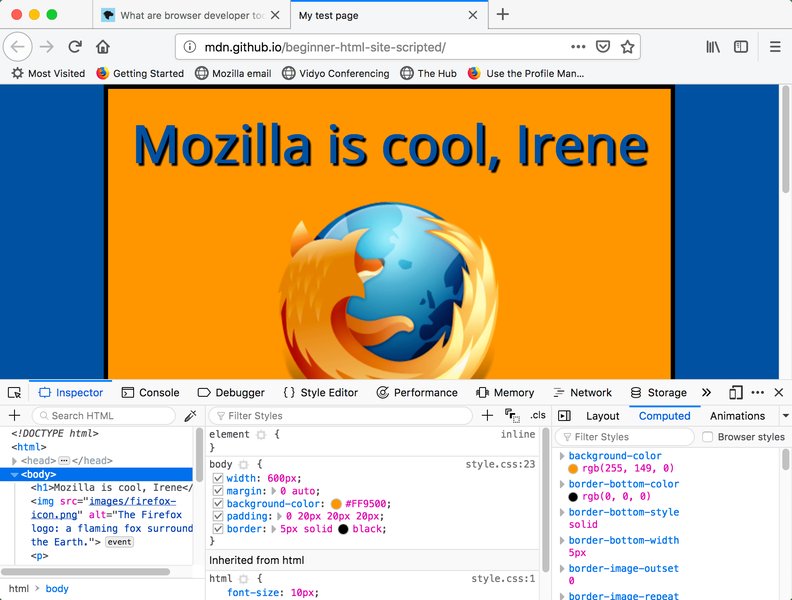
An example of the Elements panel in browser developer tools, showing HTML structure and associated CSS styles.
The Console Panel: JavaScript Debugging and Logging
The Console panel is a critical tool for debugging JavaScript issues. It displays error messages, warnings, and informational messages logged by the webpage's scripts. Support engineers can use the Console to:
- Pinpoint JavaScript errors and their exact location in the code.
- Execute JavaScript commands directly in the browser context to test functions or retrieve data.
- Utilize
console.log()statements to track variable values and execution flow, helping to understand complex script behavior.
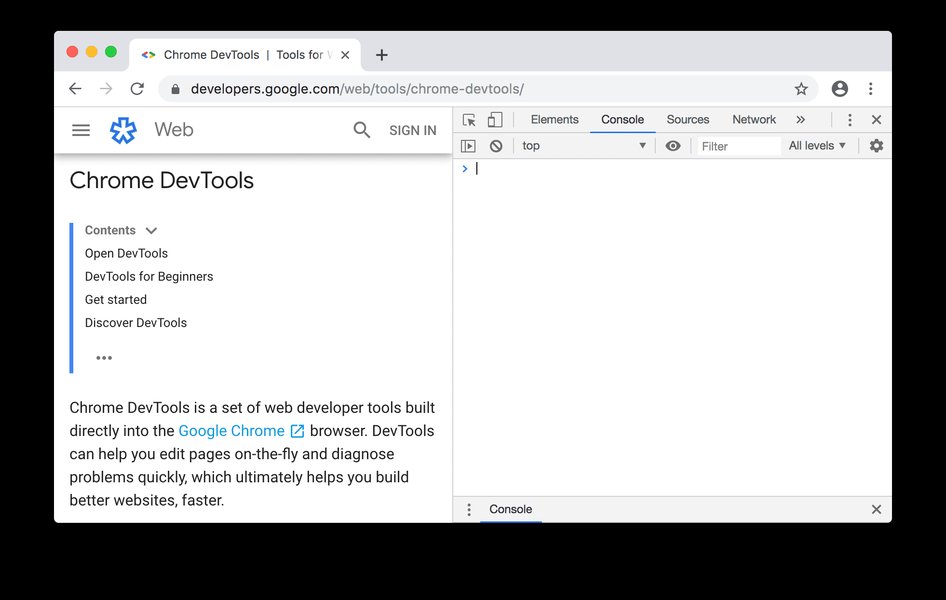
The Console panel in Chrome DevTools, displaying log messages and allowing direct JavaScript execution.
The Network Panel: Analyzing Data Flow
The Network panel provides a detailed overview of all network requests made by the webpage, including images, scripts, stylesheets, and API calls. This panel is invaluable for diagnosing connectivity issues, slow loading times, or incorrect data fetching. Support engineers can use it to:
- Monitor the status of HTTP requests (e.g., 200 OK, 404 Not Found, 500 Internal Server Error).
- Examine request and response headers, parameters, and payloads.
- Identify which resources are taking a long time to load, indicating potential performance bottlenecks.
- Verify that expected API calls are being made correctly.
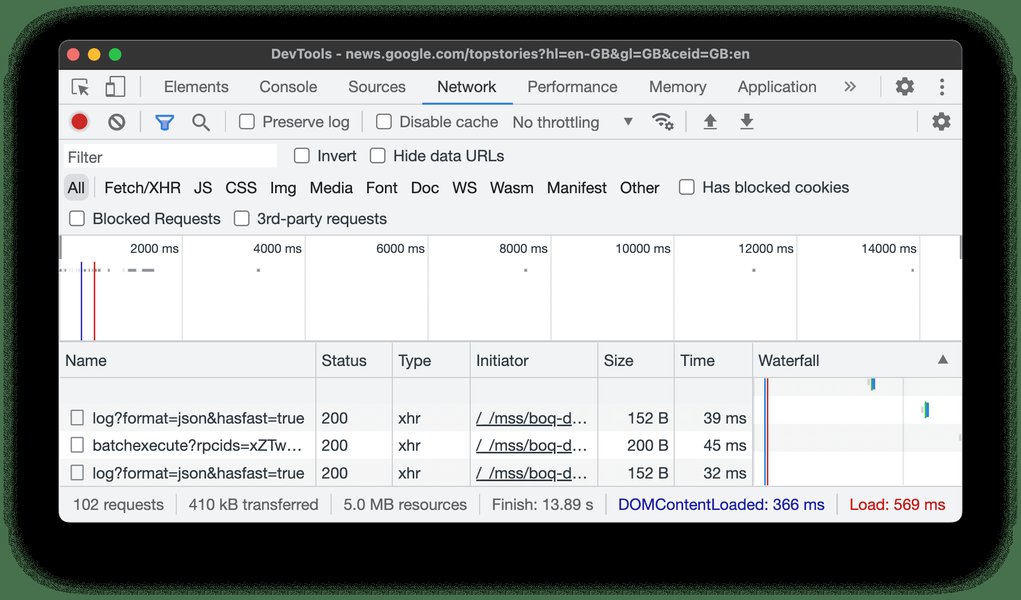
The Network panel in Chrome DevTools, showing a waterfall of network requests and their loading times.
Performance and Application Panels: Optimization and Storage
Beyond basic debugging, DevTools offer panels for deeper analysis:
- Performance Panel: Helps identify runtime performance issues such as slow script execution, rendering bottlenecks, and layout thrashing. This is useful for understanding why a page might feel sluggish to a user.
- Application Panel: Allows inspection and management of various client-side storage mechanisms like Local Storage, Session Storage, IndexedDB, Cookies, and Cache Storage. This is crucial for debugging issues related to user data persistence or offline capabilities.
Practical Applications for Support Engineers
The versatility of browser developer tools extends to many common scenarios encountered by support engineers.
Troubleshooting User Interface and Experience Issues
When a user reports that "something looks wrong" or "a button isn't working," DevTools become the primary diagnostic instrument. Support engineers can:
- Inspect the element in question to see if its CSS properties are being overridden or if there are unexpected JavaScript event listeners.
- Use the Device Mode to replicate the user's screen size or mobile device to see if the issue is responsive-design related.
- Check the Console for any errors that might explain why an interactive element isn't functioning as expected.
Diagnosing Performance Problems
Slow-loading pages or sluggish interactions significantly impact user satisfaction. With DevTools, support engineers can:
- Analyze the Network panel to identify large assets or slow API calls that are delaying page rendering.
- Use the Performance panel to record a user interaction and pinpoint JavaScript execution or rendering inefficiencies.
- Identify memory leaks using the Memory panel, which can cause long-term performance degradation.
Validating Data and Connectivity
Many web applications rely on data fetched from backend services. If a user reports incorrect or missing data, DevTools can help:
- Verify that the correct API requests are being sent and received using the Network panel.
- Inspect the response payload from API calls to ensure the data format is as expected and contains the necessary information.
- Check for cross-origin resource sharing (CORS) errors in the Console or Network panel, which can block data communication.
Advantages of Integrating DevTools into Support Workflows
The strategic use of browser developer tools offers numerous advantages, transforming how support engineers approach problem-solving.
Speed and Efficiency in Troubleshooting
The ability to work in real-time within the browser significantly speeds up the debugging process. Instead of needing to set up a local development environment or deploy test builds, support engineers can make on-the-fly modifications to HTML, CSS, or even execute JavaScript to test hypotheses immediately. This rapid iteration reduces the time to identify the root cause of an issue.
Consider the difference: without DevTools, a support engineer might need to ask the user for screenshots, try to reproduce the issue based on limited information, or escalate to a developer who would then need to set up their environment. With DevTools, many issues can be diagnosed and even temporarily "fixed" for demonstration purposes directly in the user's browser, leading to faster resolution times.
Enhanced Communication with Development Teams
When an issue requires escalation to a development team, the detailed insights gained from DevTools are invaluable. Support engineers can provide precise information:
- Specific CSS rules that are causing a display bug.
- Exact JavaScript error messages, including stack traces.
- Network request details that show why an API call failed.
- Performance timelines highlighting bottlenecks.
This level of detail eliminates ambiguity, reduces back-and-forth communication, and allows developers to jump directly to the problem area, significantly improving the efficiency of the bug resolution lifecycle.
Proactive Problem Identification
Beyond reactive troubleshooting, support engineers can use DevTools proactively. For instance, before a major release, they can perform quick checks on key user flows, observing the Console for warnings or the Network panel for unexpected requests. This proactive approach can help catch potential issues before they impact a wider user base, improving overall product stability.
The Impact of AI Assistance in DevTools
The integration of AI assistance into browser developer tools marks a significant evolution, promising to further empower support engineers. For instance, Chrome DevTools is exploring AI assistance to support debugging workflows across styling, performance, and more. This means support engineers might soon be able to leverage AI to:
- Generate prompt ideas for fixing code snippets.
- Get contextual explanations for complex errors.
- Receive suggestions for performance optimizations.
This AI integration could dramatically lower the barrier to entry for complex debugging tasks and enable support engineers to resolve even more intricate issues without direct developer intervention, freeing up development resources for new features.
An introduction to AI Assistance in Chrome DevTools, highlighting its potential for simplifying debugging workflows.
A Comparative Overview: DevTools Proficiency
The proficiency levels in various aspects of browser developer tools can vary among different roles within a tech organization. This radar chart illustrates a hypothetical comparison, emphasizing why specific proficiencies are more critical for support engineers versus core software engineers.
This radar chart visually represents the typical comparative strengths in different areas of browser developer tools for a Support Engineer versus a Software Engineer. Support Engineers often excel in direct UI/UX debugging (Elements, Console) and network analysis due to their troubleshooting focus, while Software Engineers might have deeper expertise in performance optimization and security audits as part of the development lifecycle.
Key Toolsets for Support Engineers
While browser developer tools are essential, support engineers leverage a broader ecosystem of tools to manage and resolve issues comprehensively.
Complementary Tools for a Support Engineer's Workflow
Beyond browser DevTools, a support engineer's toolkit often includes:
- Incident and Problem Management Systems: Tools like Jira or Zendesk for logging, tracking, and managing customer issues throughout their lifecycle.
- Monitoring and Alerting Tools: To observe system health and receive notifications about potential issues.
- Log Management and Analysis Tools: For sifting through server-side logs to find clues related to reported bugs.
- Database Management Tools: To inspect and sometimes modify data directly if an issue stems from data corruption or incorrect entries.
- Version Control Systems (e.g., Git, GitHub, GitLab): For accessing and understanding the codebase, even if they don't primarily write production code. This helps in understanding changes and pinpointing where an issue might have been introduced.
Overview of Essential Support Engineer Tools
The following table summarizes various tools and their primary use cases for a support engineer:
| Tool Category | Examples | Primary Use Cases for Support Engineers |
|---|---|---|
| Browser Developer Tools | Chrome DevTools, Firefox Developer Tools, Edge DevTools | Real-time debugging of HTML, CSS, JavaScript; network request analysis; performance monitoring; inspecting local storage. |
| Incident/Problem Management | Jira, Zendesk, ServiceNow | Logging, tracking, prioritizing, and managing customer support tickets and bug reports. |
| Log Management & Analysis | Splunk, ELK Stack (Elasticsearch, Logstash, Kibana) | Collecting, centralizing, and analyzing application and server logs to diagnose issues. |
| Monitoring & Alerting | PagerDuty, Prometheus, Grafana | Observing system health, performance metrics, and receiving automated alerts for anomalies. |
| Version Control Systems | GitHub, GitLab, BitBucket | Accessing code repositories, understanding code changes, and linking issues to specific commits. |
| Database Management | SQL Developer, DBeaver, MongoDB Compass | Querying, inspecting, and sometimes modifying database records to resolve data-related issues. |
| Remote Support/Access | TeamViewer, AnyDesk | Securely accessing user machines to troubleshoot issues directly. |
FAQ: Browser Developer Tools for Support Engineers
Conclusion
For a support engineer, especially in today's complex web landscape, proficiency with browser developer tools is no longer optional—it's foundational. These built-in utilities empower them to move beyond mere symptom reporting to in-depth client-side diagnostics. By leveraging the Elements, Console, Network, and other panels, support engineers can efficiently identify the root causes of user issues, whether they stem from layout glitches, script errors, or network communication failures. This capability not only accelerates problem resolution but also significantly enhances collaboration with development teams, leading to more robust and stable web applications. As AI continues to integrate into DevTools, the power and accessibility of these instruments for support professionals are only set to grow, making them even more indispensable in the quest for seamless user experiences.
Recommended Further Exploration
- Advanced Chrome DevTools techniques for debugging
- Role of a Developer Support Engineer in a SaaS company
- Integrating AI in web development workflows
- Best practices for client-side performance optimization
Referenced Search Results
 aws.amazon.com
