
Interpreting Survey Results from Uploaded Graphs
A Comprehensive Guide to Analyzing and Reporting Survey Data
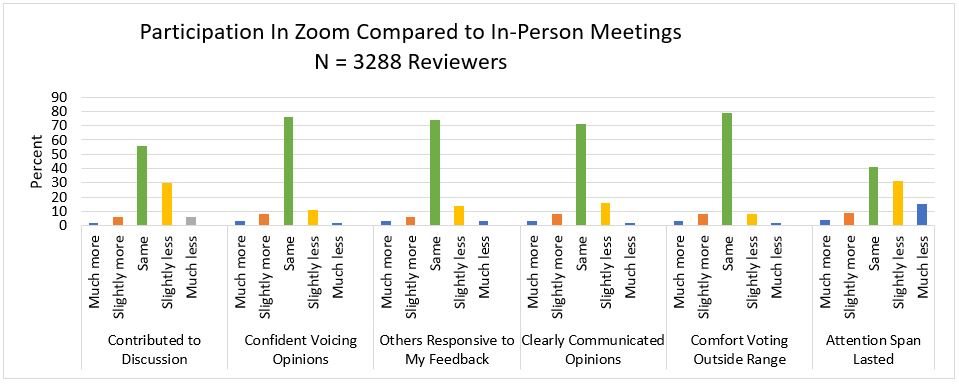
Key Highlights
- Data Visualization Techniques: Learn how to choose and interpret various graph types.
- Structured Reporting: An outline for creating an in-depth, organized report.
- Actionable Insights: How to extract meaningful conclusions to support decision-making.
The process of interpreting survey results from uploaded graphs is a valuable exercise which transforms raw data into meaningful insights. By converting numerical and qualitative feedback into visual formats such as bar charts, pie charts, histograms, and line graphs, you can easily observe patterns, changes, and trends. Understanding these visual depictions not only simplifies data analysis but also aids in producing a comprehensive report that informs strategic decision-making.
1. Preparing for Data Interpretation
1.1 Understanding the Survey Objectives
Before diving into the analysis, it is critical to recall the objectives of your survey. Clearly identifying the goals helps direct your focus toward the most relevant aspects of the data. Typically, surveys are conducted to measure satisfaction levels, track market trends, gather user opinions, or evaluate the performance of a service or product. By reiterating these objectives, you can immediately place your findings within context when interpreting each graph.
1.2 Knowing Your Data Types
Surveys yield both quantitative and qualitative data. Quantitative data is numerical and often represented through charts and graphs with exact values (like percentages and frequencies), while qualitative data offers descriptive insights, often captured in open-ended responses. Recognizing the type of data provided in your graphs determines the methods you’ll use for presentation, such as:
- Pie Charts: Ideal for displaying proportional data where the whole is divided into distinct segments.
- Bar Graphs: Effective for comparing different groups or tracking changes over time.
- Line Graphs: Useful for highlighting trends across continuous data points.
- Histograms: Best for understanding the distribution of responses for a particular question.
2. Analyzing the Graphs
2.1 Data Visualization Techniques
Interpreting Different Graph Types
When reviewing graphs, it is essential to identify what each visual representation is communicating by focusing on the following aspects:
- Axes and Scales: Ensure that both the horizontal (x-axis) and vertical (y-axis) are clearly labeled. The axis labels provide context such as the range of responses or time intervals.
- Legends and Colors: Graph legends explain the color-coding or symbols used, which is especially important if multiple datasets are overlaid on a single graph.
- Data Points and Trends: Observe data clusters, outliers, and trends. For example, a line graph might display a steady upward trend in customer satisfaction, whereas a bar graph might reveal a specific category that significantly differs from the rest.
- Comparative Analysis: Compare the segments or data groups within each graph. Pay attention to any anomalies that might indicate irregular behavior or response issues.
Identifying Trends, Patterns, and Outliers
Understanding trends and outliers becomes crucial as you correlate the visual data with the survey’s objectives. For instance, if the majority of respondents provide positive feedback, this trend suggests overall satisfaction. However, also look for outliers – those rare data points that differ significantly from the bulk of responses. Outliers may indicate areas requiring further investigation, such as specific customer grievances or unexpected behavior.
2.2 Contextual Analysis
Interpreting the graphs should not be a purely isolated exercise. It requires synthesizing both the visual data and the background context, such as:
- Survey Methodology: Consider how the survey was distributed, the sample size, and the demographics of the respondents.
- Market or Industry Trends: Compare your survey results against current trends and broader industry data. For example, if a survey on product satisfaction shows increased current interest in eco-friendly features, it may reflect broader market expectations.
- Time Relevance: If the survey spans multiple time points, visual data may show trends such as seasonal variations or gradual improvements over time. Recognizing these temporal dynamics can guide future strategies.
Utilizing Comparative Tables
Tables can serve as complementary tools alongside graphs. They allow you to view the raw numbers and percentages, facilitating a more precise comparison between different survey outcomes across various segments. Below is an example table structure summarizing some typical survey results:
| Category | Response Type | Percentage / Count | Observation |
|---|---|---|---|
| Customer Satisfaction | Very Satisfied | 45% | Highest proportion indicating strong approval |
| Customer Satisfaction | Satisfied | 35% | Indicates overall conformity |
| Customer Satisfaction | Neutral | 10% | Potentially indicates areas for improvement |
| Customer Satisfaction | Dissatisfied | 7% | Needs immediate attention to boost performance |
| Customer Satisfaction | Very Dissatisfied | 3% | Small but critical group highlighting major issues |
3. Writing the Report
3.1 Structuring the Report
The effectiveness of your analysis is best showcased in a well-organized and meticulously crafted report. Here is a recommended structure:
Introduction
Begin your report by outlining the survey’s primary purpose and objectives. Explain the context in which the survey was conducted, including any relevant background information such as market conditions, organizational changes, or industry trends. Additionally, provide a concise overview of the survey methodology—how data was collected and the rationale behind the chosen sampling method.
Methodology
Describe the methodology in detail, including:
- The type of survey conducted (e.g., online, telephonic, paper-based).
- Sample size and demographics of respondents.
- The instruments used to gather data.
- Any steps taken to ensure data accuracy and reliability.
This section establishes the foundation of your report, inspiring confidence in the data’s credibility.
Analysis and Results
This is the core of your report where the uploaded graphs and corresponding analyses are discussed. For each graph, include the following:
- Description: Briefly explain what the graph illustrates.
- Interpretation: Discuss key insights, trends, and patterns. Explain what these observations mean in the context of your survey’s objectives.
- Comparative Insights: Compare the findings from different graph types or survey segments, identifying consistent patterns or unexpected deviations.
For instance, if a bar graph indicates that 45% of respondents are very satisfied with a service, discuss not only the positive aspect but also supplement this with relevant trends observed in other graphs, such as changes over time or demographic variations.
Visual Tables and Graphs
Incorporate both visual aids and tables that complement your written analysis. This balanced approach helps your audience verify the data and facilitates a deeper understanding of your findings. Embed visual references near key points and include descriptive captions to ensure clarity.
Discussion
In the discussion section, contextualize the results within the broader objectives of the survey. Consider external variables that may have influenced responses such as seasonal trends, recent market events, or changes in customer perception. Delve into unexpected findings; for example, if a minority group provides disproportionately negative feedback, reflect on potential causes and implications.
Conclusions and Recommendations
Draw together the main insights from your analysis in a concise conclusion. Summarize the overall trends and critical takeaways, emphasizing how the visualized data aligns with the survey’s objectives. It is important to note actionable recommendations: based on the identified trends, suggest practical steps to address any issues or capitalize on positive findings.
For example, if a significant segment of respondents is dissatisfied with a particular product feature, recommend an investigation into the usability or quality improvement. Similarly, if positive sentiments are observed, propose strategies to further enhance and market these strengths.
4. Actionable Insights and Strategic Applications
4.1 From Data to Strategy
The ultimate objective of interpreting survey results is to translate data into actionable strategy. Once you have identified key trends and patterns, use the insights generated to develop strategic initiatives. This could include refining product features, adjusting marketing tactics, or even re-evaluating customer service policies.
An effective strategy should be data-driven; for example, if a majority of your survey participants indicate that price is a significant factor in their dissatisfaction, consider a thorough cost analysis or promotional offers that target price sensitivity. Similarly, if the survey shows high satisfaction with a recent innovation, plan to leverage this insight in promotional materials and future product development.
4.2 Implementing Recommendations
Based on the survey insights, here are ways to implement actionable recommendations:
- Product Development: Use feedback to iterate on features or enhance product designs that receive high praise, while addressing areas of frequent criticism.
- Marketing Adjustments: Develop targeted campaigns based on audience segments that exhibited strong responses or deteriorating perceptions.
- Customer Relations: Initiate follow-up surveys or focus groups with hesitant respondents to better understand their perspectives and adjust your customer engagement accordingly.
- Operational Improvements: In cases where logistical or service delivery weaknesses are noted, re-evaluate internal processes to support more efficient operations.
Integrating these recommendations ensures that your survey not only serves a diagnostic purpose but also acts as a catalyst for measurable improvements.
5. Reporting Best Practices and Final Considerations
5.1 Language, Clarity, and Objectivity
The success of a survey report is largely dependent on the clarity and objectivity with which information is presented. Use simple, direct language to explain technical or statistical terms. This is important especially if your audience includes stakeholders who may not have a technical background.
Maintain an objective tone throughout the report. Provide clear evidence for each interpretation, and ensure that your conclusions are strictly based on the data as visualized in the graphs. Avoid inserting personal biases or unfounded assumptions.
5.2 Combining Visual and Textual Data
A harmonious balance of visual data and textual description is essential. Graphs capture the eye and can effectively communicate general trends, while well-composed paragraphs fill in the nuances that visuals may miss. When both are used in tandem, the final report becomes a comprehensive document that tells the complete story behind the numbers.
This approach facilitates better understanding and allows stakeholders to independently verify your interpretations by referencing raw figures alongside attractive, digestible graphics.
5.3 Continuity and Future Surveys
In addition to reporting the current findings, it is beneficial to suggest follow-up measures or future surveys. This extended analysis ensures that the conversation around key issues remains ongoing. Recommendations for periodic testing can help track the impact of implemented changes over time, providing valuable feedback for continuous improvement.
Establish benchmarks based on your current survey data and use them as reference points for future comparisons. This strategic continuity helps ensure that the survey process evolves along with changes in the market or customer behavior.
Conclusion
In summary, if you upload graphs of survey results, interpreting and reporting on them is an achievable process that transforms raw data into insightful, actionable strategies. Begin by clearly understanding the survey objectives and the types of data you have collected. Use appropriate visualization techniques like pie charts, bar graphs, and histograms to represent the data effectively. As you analyze these graphs, focus on key trends, data outliers, and the overall distribution of responses. Contextual factors such as the survey methodology, market conditions, and demographic details further enhance your interpretation.
The report should be structured logically, starting with an introduction and methodology, followed by detailed analysis, discussion, and finally, conclusions and actionable recommendations. A well-integrated balance of visuals and textual analysis not only clarifies the insights but also supports strategic decision-making for product development, marketing strategies, and customer engagement. Ultimately, this process ensures that your survey data is leveraged to drive informed business growth and continuous improvement.
References
- How to Analyze Survey Results - ChartExpo
- Interpret Survey Data - Constant Contact
- Guide to Analyzing Survey Data - SurveyPlanet
- Survey Report Examples - JotForm
- How to Write a Survey Report - Kapiche
Recommended Related Queries
Last updated February 21, 2025