
Mastering Swing Trading: A Comprehensive Multi-Timeframe Strategy
Aligning Daily Trends with Precise Entry Points for Optimal Trading Success
Key Takeaways
- Multi-Timeframe Analysis: Utilize 1D for trend bias, 4H for confirmation, and 1H/15min for precise entries.
- Risk Management: Implement strict risk controls with a favorable risk-reward ratio to safeguard capital.
- Indicator Integration: Combine moving averages, RSI, and volume indicators to enhance trade confirmations.
Introduction to Swing Trading Strategies
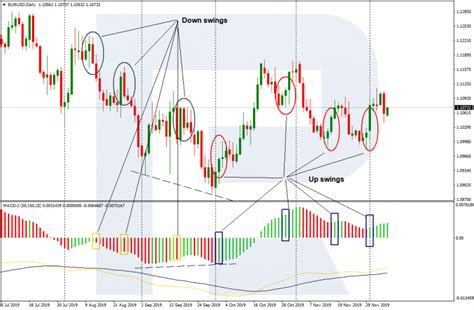
Swing trading is a popular trading style that seeks to capture short- to medium-term gains in a stock (or any financial instrument) over a period of a few days to several weeks. Unlike day trading, which involves multiple trades within a single day, swing trading focuses on benefiting from the natural swing of the market. An effective swing trading strategy can significantly enhance trading performance by aligning trades with the prevailing market trends while optimizing entry and exit points.
Multi-Timeframe Analysis: The Foundation of Swing Trading
Multi-timeframe analysis is a cornerstone of sophisticated swing trading strategies. By analyzing different timeframes, traders can gain a comprehensive view of the market, ensuring that their trades align with both short-term movements and long-term trends. This approach reduces the risk of trading against the prevailing market direction and enhances the probability of successful trades.
1. Establishing Directional Bias with the 1D Chart
The daily chart (1D) serves as the primary timeframe for identifying the overall trend or bias. Establishing a clear directional bias ensures that trades are aligned with the broader market movement, which is crucial for maximizing profit potential and minimizing risk.
a. Trend Identification
Begin by analyzing the 1D chart to determine the prevailing trend. This can be achieved through various methods:
- Moving Averages: Utilize the 50-day EMA and 200-day EMA to identify trend direction. A bullish trend is indicated when the 50 EMA is above the 200 EMA, while a bearish trend is confirmed when the opposite is true.
- Price Action: Look for higher highs and higher lows in an uptrend or lower highs and lower lows in a downtrend.
- Trendlines: Draw trendlines connecting significant highs or lows to visually represent the trend.
b. Identifying Support and Resistance Levels
Mark key support and resistance levels on the daily chart. These levels act as psychological barriers where price action may reverse or consolidate, providing potential entry and exit points.
- Horizontal lines at significant daily highs and lows.
- Pivot points that denote potential reversal zones.
c. Utilizing Indicators for Confirmation
Incorporate technical indicators like the Relative Strength Index (RSI) and Moving Average Convergence Divergence (MACD) to validate the identified trend and filter out false signals.
2. Confirming the Trend with the 4H Chart
After establishing the directional bias on the daily chart, the 4-hour (4H) chart is employed to confirm the trend and identify precise entry zones. This intermediate timeframe provides a balanced perspective, bridging the gap between the long-term daily trend and the short-term entry signals.
a. Trend Strength Confirmation
Ensure that the 4H chart aligns with the daily trend. For instance, if the daily chart indicates an uptrend, the 4H chart should also reflect bullish price action.
- Check for higher highs and higher lows on the 4H chart within the context of the daily trend.
- Ensure that key moving averages on the 4H chart support the established trend.
b. Identifying Key Levels and Patterns
Draw support and resistance levels on the 4H chart that coincide with the daily chart's key levels. Look for chart patterns such as flags, triangles, or head and shoulders, which can serve as indicators of potential trend continuation or reversal.
- Breakouts above resistance or below support can signal trend continuation.
- Reversal patterns can indicate potential changes in trend direction.
c. Indicator Synchronization
Use momentum indicators like RSI and MACD on the 4H chart to confirm the strength of the trend. For example, an RSI above 50 typically supports a bullish trend, while an RSI below 50 may indicate bearish momentum.
3. Precision Entry with the 1H and 15-Minute Charts
The shortest timeframes, namely the 1-hour (1H) and 15-minute (15min) charts, are utilized to fine-tune entry points. These charts provide the granularity needed to enter trades at optimal moments, enhancing the risk-reward ratio.
a. Identifying Entry Triggers
Look for specific price action signals that align with the established trend and confirmed by higher timeframes. These may include:
- Candlestick Patterns: Bullish engulfing, hammer, or doji patterns for long entries; bearish engulfing, shooting star for short entries.
- Breakouts: Entry upon breaking key support or resistance levels.
- Retracements: Using Fibonacci retracement levels (e.g., 50% or 61.8%) to identify pullback areas within the trend.
b. Confirming with Indicators
Apply indicators on the 1H and 15min charts to validate entry signals:
- RSI: Ensure that the RSI is moving in the direction of the trade and is not in overbought or oversold territory.
- Volume Indicators: Increased volume can confirm the strength of a breakout or reversal pattern.
c. Setting Stop-Loss and Take-Profit Levels
Define risk parameters to protect against adverse market movements:
- Stop-Loss: Place stop-loss orders just below the recent swing low for long positions or just above the recent swing high for short positions.
- Take-Profit: Set take-profit targets at key resistance levels (for longs) or support levels (for shorts) identified on the daily or 4H charts.
4. Comprehensive Risk Management
Effective risk management is paramount to the longevity and success of any trading strategy. By adhering to disciplined risk controls, traders can mitigate losses and safeguard their capital.
a. Position Sizing
Determine the appropriate position size based on the distance to the stop-loss level and the percentage of trading capital you are willing to risk (typically 1-2% per trade).
b. Risk-Reward Ratio
Ensure that each trade offers a favorable risk-reward ratio, ideally 1:2 or higher. This means that the potential reward should be at least twice the potential risk.
c. Diversification
Avoid concentrating all trades in a single asset or market sector. Diversifying across different assets can reduce the impact of adverse movements in any one market.
5. Practical Example of the Multi-Timeframe Swing Trading Strategy
To illustrate the application of this strategy, let's walk through a hypothetical trade scenario:
Step 1: Analyzing the Daily Chart (1D)
- Trend Identification: The 50-day EMA is above the 200-day EMA, indicating a bullish trend. Price action shows higher highs and higher lows.
- Support Level: A key support level is identified at $150, where the price has previously bounced.
- Indicator Confirmation: RSI is at 60, and MACD indicates bullish momentum.
Step 2: Confirming with the 4H Chart
- Trend Alignment: The 4H chart also shows an uptrend with higher highs and higher lows.
- Chart Patterns: A bullish flag pattern is forming near the support level, suggesting potential continuation.
- Indicator Signals: RSI on the 4H chart is rising, and MACD is above the signal line.
Step 3: Entering the Trade on the 1H/15min Charts
- Entry Trigger: On the 15min chart, a bullish engulfing candlestick forms near the 4H flag pattern's support zone.
- Volume Confirmation: Increased volume accompanies the candlestick pattern, confirming the strength of the move.
- Stop-Loss Placement: A stop-loss is placed at $148, just below the recent swing low.
- Take-Profit Target: The take-profit is set at $160, targeting the next resistance level identified on the daily chart.
Step 4: Managing the Trade
- Monitor the trade by watching the 1H and 15min charts for any signs of reversal.
- Adjust the stop-loss to break even once the price moves favorably past the initial target by half.
- Consider scaling out of the position as the price approaches the take-profit target to lock in profits.
Enhancing the Strategy with Technical Indicators
Integrating technical indicators can provide additional layers of confirmation and improve the overall effectiveness of the swing trading strategy.
1. Moving Averages
Moving averages smooth out price data to identify trends over specific time periods. In this strategy:
- 50 EMA: Helps determine the short- to medium-term trend direction.
- 200 EMA: Serves as a long-term trend indicator, providing significant support or resistance levels.
2. Relative Strength Index (RSI)
The RSI measures the speed and change of price movements, oscillating between 0 and 100:
- Overbought/Oversold Levels: RSI above 70 indicates overbought conditions, while below 30 signifies oversold conditions.
- Trend Confirmation: RSI staying above 50 supports a bullish trend; below 50 supports a bearish trend.
3. Moving Average Convergence Divergence (MACD)
MACD is used to identify changes in the strength, direction, momentum, and duration of a trend:
- Signal Line Crossovers: When the MACD line crosses above the signal line, it generates a bullish signal, and vice versa for bearish signals.
- Divergence: Divergence between MACD and price can indicate potential trend reversals.
4. Volume Indicators
Volume plays a crucial role in validating price movements:
- Volume Spikes: Significant increases in volume can confirm the strength of a breakout or reversal pattern.
- Volume Trends: Rising volume during uptrends or downtrends supports the continuation of the trend.
Implementing the Strategy: Step-by-Step Guide
To ensure consistency and discipline in trading, follow this structured approach:
Step 1: Analyze the Daily Chart (1D)
- Identify the prevailing trend using moving averages and price action.
- Mark significant support and resistance levels.
- Confirm trend strength with RSI and MACD indicators.
Step 2: Confirm with the 4H Chart
- Ensure alignment of the trend with the daily chart.
- Identify key chart patterns and breakout signals.
- Validate with momentum indicators like RSI and MACD.
Step 3: Execute Entry on the 1H/15min Charts
- Look for precise entry triggers such as candlestick patterns or breakouts.
- Confirm with volume indicators to ensure trade strength.
- Place stop-loss orders to manage risk effectively.
- Set take-profit targets based on higher timeframe resistance or support levels.
Step 4: Manage the Trade
-
Monitor the trade through the 1H and 15min charts.
-
Adjust stop-loss levels to lock in profits as the trade moves favorably.
-
Scale out of the position as predefined take-profit levels are approached.
Tools and Indicators for Enhanced Trading
Leveraging the right tools and indicators can significantly improve the efficacy of the swing trading strategy:
| Indicator | Purpose | Application |
|---|---|---|
| 50 EMA & 200 EMA | Trend Identification | Determine the direction of the medium and long-term trend. |
| RSI | Momentum Measurement | Identify overbought or oversold conditions and confirm trend strength. |
| MACD | Trend and Momentum Analysis | Detect changes in trend direction and momentum through crossovers and divergence. |
| Volume Indicators | Trade Confirmation | Validate the strength of price movements and breakout events. |
| Fibonacci Retracement | Pullback Identification | Find potential entry points during trend retracements. |
Common Pitfalls and How to Avoid Them
Even the most well-structured strategies can falter if common trading mistakes are not addressed. Awareness and proactive management can help mitigate these risks.
1. Ignoring the Higher Timeframe
Trading against the broader market trend increases the likelihood of encountering adverse price movements. Always align trades with the daily chart bias.
2. Overtrading
Entering too many trades can lead to increased transaction costs and reduced focus on high-quality setups. Be selective and patient, waiting for optimal trade signals.
3. Poor Risk Management
Failing to set appropriate stop-loss levels or risking too much capital on a single trade can lead to significant losses. Adhere to strict risk management rules to protect your capital.
4. Ignoring Market News and Events
Fundamental news and economic events can significantly impact market movements. Stay informed about relevant news that could affect your trades.
Conclusion
Implementing a multi-timeframe swing trading strategy that utilizes the 1D chart for bias, the 4H chart for confirmation, and the 1H/15min charts for precise entries can significantly enhance trading performance. By aligning trades with the broader market trend, confirming with intermediate timeframes, and timing entries on shorter charts, traders can optimize their risk-reward profiles and increase the probability of successful trades. Coupled with disciplined risk management and the strategic use of technical indicators, this comprehensive approach provides a robust framework for navigating the complexities of the financial markets.
References
Last updated January 18, 2025