
Determining CaCO₃ Content in PVC Using TGA
A Comprehensive Guide on Thermogravimetric Analysis for PVC Composites
Key Highlights
- Sample Preparation & Instrument Setup: Proper sample homogenization and careful setting of heating conditions are crucial.
- Analysis of Thermal Degradation: Identification of distinct weight-loss stages distinguishes organic decomposition from CaCO₃ decomposition.
- Accurate Calculation: Using the known stoichiometry of CaCO₃ decomposition enables quantitative determination of filler content.
Introduction
Thermogravimetric Analysis (TGA) is a widely employed technique to assess the thermal stability and composition of polymer composites. For polyvinyl chloride (PVC) filled with calcium carbonate (CaCO₃), TGA offers a method to determine the precise CaCO₃ content by monitoring the mass loss of the sample as it is heated. This method relies on the distinct thermal degradation behaviors of PVC and CaCO₃, allowing us to pinpoint where the filler begins to decompose relative to the polymer matrix.
In a typical TGA experiment for PVC/CaCO₃ composites, as the sample is gradually heated, the organic PVC matrix decomposes at lower temperatures, typically releasing volatile substances (e.g., hydrogen chloride from dehydrochlorination) followed by complex polymer breakdown. At higher temperatures, the inorganic CaCO₃ begins to decompose, liberating carbon dioxide (CO₂) and leaving behind calcium oxide (CaO). Through careful analysis of the TGA weight loss curve and application of stoichiometric calculations, the content of CaCO₃ in the composite can be accurately determined.
Procedure for TGA Analysis
Sample Preparation
The quality and representativeness of the sample are fundamental for reliable TGA results. Begin by ensuring that the PVC/CaCO₃ composite sample is homogenized and finely ground. This step ensures uniform heating and prevents errors due to uneven decomposition.
Steps in Sample Preparation
- Homogenization: The sample must be well-mixed to guarantee that both the PVC matrix and filler are evenly distributed.
- Particle Size: Grind the sample to reduce particle size, ensuring it fits within the recommended mass (typically 2 to 50 milligrams) for sensitive detection.
- Representative Sampling: Draw multiple small aliquots from the homogenized bulk to avoid local variations.
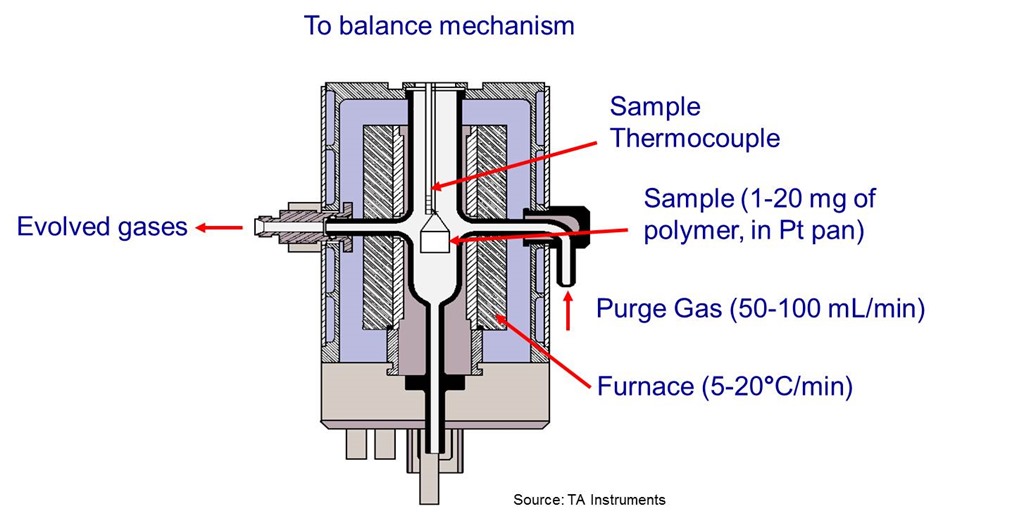
TGA Instrument Setup
Setting up the TGA correctly is a critical part of the process. The instrument should be capable of controlled heating, accurate weight measurements, and the ability to switch between different gaseous atmospheres if necessary.
Instrument Configuration
- Temperature Range: Configure the TGA to heat from room temperature up to approximately 900°C. This would capture the full degradation range, from the breakdown of the organic matrix to the decomposition of CaCO₃.
- Heating Rate: A controlled heating rate, typically between 5°C/min to 20°C/min, is essential. Rates such as 10°C/min are commonly chosen to balance resolution and experimental time.
- Atmosphere Selection: Initially, an inert atmosphere (commonly nitrogen) is used to prevent oxidation of the sample, particularly during the early organic degradation stages. In experiments where full combustion is essential, a switch to an oxygen-rich environment may occur after the initial heating phase.
- Sample Mass: Ensure that the mass of the sample is optimized (a few milligrams) to match the sensitivity and detection capabilities of the instrument.
Thermal Degradation Analysis
The TGA experiment monitors the weight loss of the composite as the temperature is increased. PVC decomposes through multiple phases starting at a relatively lower temperature, while CaCO₃ exhibits significant weight loss at high temperatures as it decomposes into CaO and CO₂.
Decomposition Stages
- Organic Decomposition: PVC begins degrading around 200–300°C. The dehydrochlorination process releases HCl, and further breakdown produces several volatile organic compounds. The initial stage results in a steep weight loss.
- Residual Char Formation: Following the initial decomposition, char formation may occur. Such residue may later be oxidized or remain stable depending on the atmospheric conditions.
- Filler Decomposition: CaCO₃ is thermally stable until it reaches approximately 600–750°C, with the most noticeable decomposition occurring near 650-675°C. Here, CaCO₃ undergoes a decomposition reaction:
Key Reaction:
The decomposition reaction of calcium carbonate is:
$$\mathrm{CaCO_3 \rightarrow CaO + CO_2}$$
In this reaction, approximately 44% of the weight of CaCO₃ is lost as CO₂, and the remaining 56% transforms into CaO. Monitoring the weight loss within this temperature range is critical for determining the filler content.
Data Analysis and Curve Interpretation
Once the TGA run is complete, the analyzed data is presented in the form of a weight loss curve. The curve typically has distinct regions corresponding to different decomposition events. The initial region shows rapid weight loss due to dehydrochlorination and breakdown of the polymer chain, whereas the second major loss corresponds to the decomposition of CaCO₃.
Interpretation of the TGA Curve
- First Weight Loss Step: At temperatures below 500°C, the weight loss is primarily due to the breakdown of the PVC matrix.
- Second Weight Loss Step: At higher temperatures (around 650–675°C), the additional weight loss is attributable to the decomposition of CaCO₃. This weight loss reflects the release of CO₂, and the remaining residue, chiefly CaO, indicates the presence of the CaCO₃ filler.
- Residue Analysis: After complete decomposition of the organic components, the remaining mass is largely inorganic. By comparing this residue with that from a pure PVC sample (without filler), one can isolate the contribution of the CaCO₃ filler.
Quantitative Determination of CaCO₃ Content
The quantitative estimation of CaCO₃ content in a PVC composite relies on the known stoichiometric conversion that occurs during the decomposition of CaCO₃, as well as the differential weight losses observed in the TGA curve.
Calculation Methodology
After identifying and isolating the weight loss that corresponds to the decomposition of CaCO₃ on the TGA curve, the following steps are used to calculate the content:
Decomposition Reaction Revisited
Recall that the thermal decomposition of CaCO₃ is expressed as:
$$\mathrm{CaCO_3 \rightarrow CaO + CO_2}$$
Given that the molecular weight of CaCO₃ is approximately 100 g/mol and that of CO₂ is 44 g/mol, the fraction of weight lost due to CO₂ is 44%. Consequently, the remaining mass (CaO) represents 56% of the original CaCO₃ mass.
Therefore, if the observed weight loss in the TGA curve in the temperature range corresponding to CaCO₃ decomposition is W%, the original CaCO₃ content can be estimated using the formula:
$$\text{CaCO₃ content} = \frac{W\%}{0.44}$$
This formula assumes that the measured weight loss is exclusively due to the CO₂ release. The result should then be compared or calibrated against standards with known CaCO₃ percentages in PVC.
Using Residue Comparison
Another approach to estimating CaCO₃ content involves examining the final residue left after complete decomposition of the organic matrix. This method is particularly useful when the TGA is conducted in conditions where the CaCO₃ remains un-decomposed (such as in a fully inert atmosphere).
Residue-Based Analysis
- Baseline Establishment: First, perform a TGA experiment on pure PVC under identical conditions to determine the expected organic residue.
- Composite Analysis: Run a parallel experiment on the PVC/CaCO₃ composite.
- Comparison: The difference in the final residue mass between the pure PVC and the composite sample is attributed to the presence of CaCO₃. By factoring in the expected conversion of CaCO₃ to CaO (i.e., CaO represents 56% of the original CaCO₃ mass), one can calculate the original filler content.
Tabulated Calculation Example
| Parameter | Value/Observation | Description |
|---|---|---|
| Initial Sample Weight | 10 mg | Weight of the PVC/CaCO₃ composite |
| Weight after PVC Decomposition | 4 mg | Residual weight after organic decomposition (PVC removed) |
| Weight Loss Associated with CaCO₃ Decomposition (CO₂ Release) | 2 mg | Observed loss in the corresponding temperature range |
| Calculated CaCO₃ Content (%) | (2 mg / 0.44) / 10 mg × 100 ≈ 45.5% | Determined by adjusting for the 44% weight loss during decomposition |
This example illustrates how by measuring the weight loss (which, in this scenario, is 2 mg corresponding to the CO₂ released), one can back-calculate the original amount of CaCO₃ in the composite sample.
Critical Considerations in the TGA Analysis
Atmospheric Conditions and Their Impact
The type of atmosphere maintained during the TGA run significantly affects the decomposition patterns of both the PVC matrix and CaCO₃ filler. An inert atmosphere such as nitrogen minimizes oxidation and prevents premature or uncontrolled degradation, thereby offering a clearer weight-loss profile. In some cases, after the organic phases are eliminated, switching to an oxygen atmosphere can ensure complete combustion of residual char.
It is important to note that the decomposition temperature of CaCO₃ might shift slightly depending on the gas environment. In an oxygen-rich atmosphere, some oxidation reactions might influence the final inorganic residue. In contrast, an inert atmosphere allows for a more controlled and predictable decomposition of CaCO₃, isolating the CO₂ release and subsequent formation of CaO.
Calibration and Validation
To ensure that the analysis is reliable and accurate, calibration against known standards is essential. Testing with pristine PVC samples (without filler) offers a baseline for comparison. Moreover, composite samples with a known percentage of CaCO₃ filler can be used to generate a calibration curve in order to improve accuracy in quantifying the filler content.
Additionally, cross-verification using complementary analytical techniques, such as X-ray fluorescence (XRF) or Fourier Transform Infrared Spectroscopy (FTIR), can further substantiate the results. Such techniques provide independent confirmation of the filler content, thereby boosting confidence in the TGA-derived values.
Potential Sources of Error
While TGA is a powerful analytical method, several potential sources of error may impact the final results:
- Overlapping Thermal Events: The degradation of PVC and the decomposition of CaCO₃ may sometimes overlap, making it challenging to precisely attribute weight losses. Use of derivative thermogravimetric (DTG) analysis can help to resolve these issues by clearly marking the maximum rates of weight loss.
- Instrumental Calibration: Regular calibration of the TGA instrument is essential for ensuring accurate weight measurements. Instrument drift or sensitivity issues can lead to systematic errors.
- Sample Inhomogeneity: Variability in the dispersion of the CaCO₃ filler within the PVC matrix can lead to inconsistent results. Hence, thorough sample preparation and the use of multiple replicates are recommended.
- Atmospheric Switching: If the experiment involves switching from an inert to an oxidative atmosphere, inconsistent transition parameters might affect the outcomes.
Advanced Techniques and Best Practices
Differential Thermogravimetric Analysis (DTG)
DTG is an enhanced computational method where the derivative of the weight loss curve is analyzed. DTG curves provide sharper peaks corresponding to rapid weight-loss events, which help in pinpointing the exact temperatures where different components undergo decomposition. This is particularly helpful in distinguishing overlapping events, such as the degradation of PVC and the decomposition of CaCO₃.
By analyzing the DTG curve, the maximum rate of weight loss can be identified. This method not only improves the accuracy of the temperature determination but also clarifies the precise point at which CaCO₃ decomposes.
Complementary Analytical Techniques
Although TGA provides a robust framework for determining the CaCO₃ content, it may be augmented by other analytical methods for enhanced accuracy:
- X-Ray Fluorescence (XRF): XRF can be employed to detect elemental composition and confirm the presence and distribution of calcium, which directly correlates with the CaCO₃ content.
- Fourier Transform Infrared Spectroscopy (FTIR): FTIR analysis can provide molecular-level confirmation by identifying characteristic absorption bands of CaCO₃.
- Calibration with Known Standards: Employing samples with known CaCO₃ concentrations improves the reliability of the TGA results and allows for the construction of calibration curves to relate the residual mass to the filler content.
Best Practices in TGA for PVC/CaCO₃ Analysis
To achieve optimal results, it is recommended to adhere to several best practices:
- Standardize Sample Preparation: Consistency in grinding, mixing, and weighing samples is essential for reproducibility.
- Ensure Regular Instrument Calibration: Frequent calibration checks and maintenance significantly reduce systematic errors.
- Conduct Multiple Runs: Running at least three replicates for each sample helps ascertain the reliability of the data.
- Document Experimental Conditions: Record detailed experimental parameters (e.g., heating rate, temperature range, and atmosphere) to enable comparability between experiments and facilitate troubleshooting.
Conclusion and Final Thoughts
Determining the CaCO₃ content in PVC using TGA is an essential technique for the analysis of composite materials. By methodically preparing the sample, setting up the TGA instrument appropriately, and carefully interpreting the weight loss curve, one can achieve accurate quantification of the inorganic filler content. The process involves identifying distinct weight-loss regions: initially the organic degradation of PVC and subsequently the decomposition of CaCO₃ into CaO and CO₂. Through stoichiometric analysis, where 44% of CaCO₃’s mass is lost as CO₂, the filler content is calculated with the equation:
$$\text{CaCO₃ content} = \frac{\text{Weight loss due to CaCO₃ decomposition}}{0.44}$$
Critical considerations such as the choice of atmospheric conditions, calibration with pure PVC samples, and the complementary use of DTG enhance the clarity and accuracy of the measurement. Moreover, adopting best practices in sample preparation and instrument calibration minimizes errors associated with overlapping thermal events and sample inhomogeneity. With TGA and accompanying analytical techniques like XRF and FTIR, researchers and engineers can obtain a robust quantification of CaCO₃ in PVC composites, which is invaluable for applications ranging from quality control in production to research on thermal stability and material performance.
In conclusion, TGA stands out as a precise, validated method for analyzing composite materials such as PVC filled with CaCO₃. Adhering closely to standardized protocols and ensuring rigorous data analysis leads to reliable results that play a critical role in material characterization and the optimization of composite formulations.
References
- Thermal Stabilities of Poly(Vinyl Chloride)/Calcium Carbonate Composites - Semantic Scholar
- Preparation and characterization of poly (vinyl chloride) calcium carbonate composites - Springer
- TGA curves of pure PVC and PVC/50% CaCO₃ foamed layer - ResearchGate
- The Materials Analyst, Part 106: Determining filler content – TGA or traditional ash tests - Plastics Today
- Thermogravimetric Analysis (TGA) Beginner's Guide - PerkinElmer
Recommended
Last updated February 20, 2025