
Unveiling Probable Error: More Than Just a Guess?
Delving into the statistical measure that quantifies uncertainty with 50% probability.
Probable Error (PE) is a statistical concept that might sound intuitive, but it carries a specific meaning related to the uncertainty and variability inherent in measurements and estimates. It provides a quantifiable range around a central value, helping us understand the likely deviation due to random chance.
Highlights
- Definition: Probable Error represents the half-width of an interval around a central statistical value (like the mean) such that there is a 50% probability that the true population value falls within that interval.
- Key Relationship: For data following a normal distribution, the Probable Error is directly related to the standard deviation (σ) by the formula: PE ≈ 0.6745 × σ.
- Core Applications: PE is notably used to assess the significance of correlation coefficients and evaluate the consistency and precision of measurement systems in quality control.
What Exactly is Probable Error?
At its core, Probable Error is a measure of dispersion or spread in a dataset, specifically focusing on the central 50% of the data. It defines a boundary around an estimated value (often the arithmetic mean or median) where the true value has an equal chance (50%) of lying inside or outside this boundary.
Probabilistic Interpretation
Imagine you've calculated the average height from a sample of people. The Probable Error associated with this average tells you the range (e.g., ± PE centimeters) around your calculated average within which the true average height of the entire population has a 50% chance of falling. Conversely, there's also a 50% chance it lies outside this range. It's a statement about the likelihood of capturing the true value within a specific margin of error.
Connection to Data Spread
For symmetric distributions, like the normal distribution, PE is closely linked to other measures of spread. It's effectively half the interquartile range (IQR), which is the range containing the middle 50% of the data. It can also be related to the Median Absolute Deviation (MAD), another robust measure of variability.
Unlike standard deviation, which considers the distance of all points from the mean, PE focuses specifically on this 50% probability threshold, offering a different perspective on the data's dispersion.
The Mathematical Link: Probable Error and Standard Deviation
For datasets that approximate a normal (Gaussian) distribution, there's a precise mathematical relationship between Probable Error and the more commonly known standard deviation (σ). This relationship is fundamental to calculating PE in many standard scenarios.
\[ \text{Probable Error (PE)} \approx 0.6745 \times \text{Standard Deviation} (\sigma) \]This formula arises directly from the properties of the normal distribution curve.
Origin of the Constant (0.6745)
The constant 0.6745 is derived from the inverse of the cumulative distribution function (or quantile function) of the standard normal distribution. Specifically, it corresponds to the z-score values that enclose the central 50% of the probability mass (i.e., between the 25th and 75th percentiles). \( \text{PE} = \Phi^{-1}(0.75) \times \sigma \approx 0.674489... \times \sigma \), where \( \Phi^{-1} \) is the quantile function.
Visualizing PE vs. σ
While standard deviation measures the typical deviation from the mean across the entire dataset (about 68% of data falls within ±1σ), Probable Error defines a narrower band (±PE) that captures exactly half (50%) of the expected variation for a normal distribution. PE represents the distance from the mean within which half the data points are expected to lie.
Applications of Probable Error
Despite being a somewhat historical measure, Probable Error still finds relevance in specific statistical contexts, particularly in assessing correlation and evaluating measurement systems.
Assessing Correlation Significance
One prominent application of PE is in determining the reliability or significance of a calculated correlation coefficient (r) between two variables. The Probable Error of the correlation coefficient (PEr) is calculated using the correlation value (r) and the sample size (n):
\[ \text{PE}_r = \frac{0.6745 \times (1 - r^2)}{\sqrt{n}} \]A common rule of thumb states:
- If the absolute value of the correlation coefficient \( |r| \) is greater than six times its probable error \( ( |r| > 6 \times \text{PE}_r ) \), the correlation is considered statistically significant and unlikely to be due to random chance.
- The values \( r \pm \text{PE}_r \) define the "probable limits," representing the range within which the true population correlation coefficient is expected to lie with 50% probability.
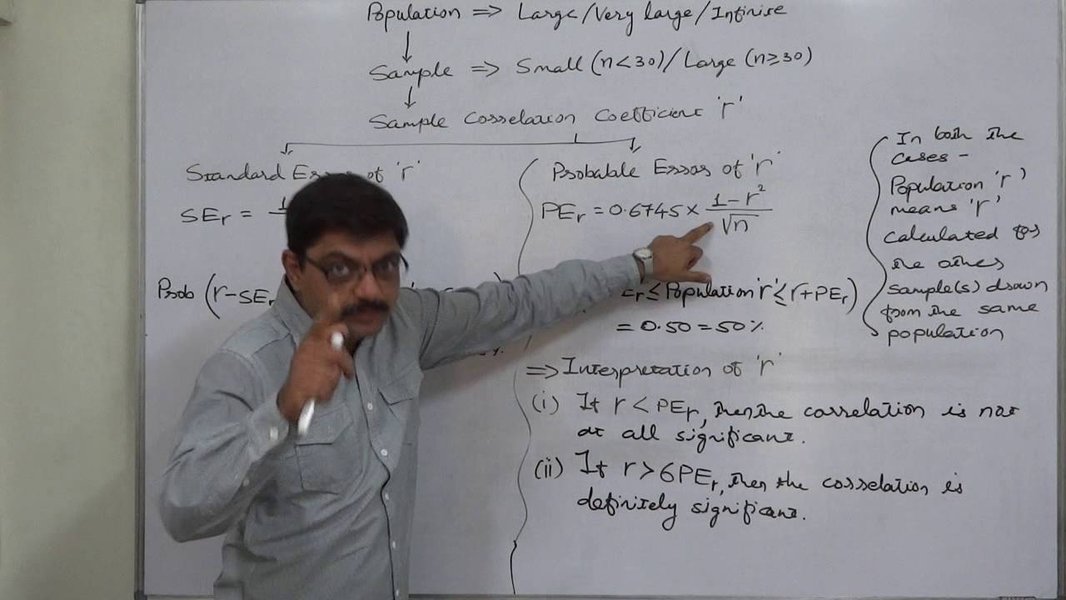
Conceptualizing errors in correlation analysis.
Evaluating Measurement Systems
In fields like engineering, manufacturing, and quality control (specifically in Measurement Systems Analysis or Gage R&R studies), PE helps assess the precision and consistency of measurement tools and processes.
- It helps define the effective measurement increment or resolution of an instrument. Differences between repeated measurements smaller than the PE might be considered statistically insignificant (noise).
- In process control charts (like X-charts), PE can contribute to understanding the expected random variation. Measurements consistently falling far outside the expected range (related to PE or standard deviation limits) might signal an issue with the measurement process itself.
- It provides a practical way to quantify the inherent uncertainty in a measurement, indicating the range within which an individual reading is likely to fall relative to the true value (assuming random error).
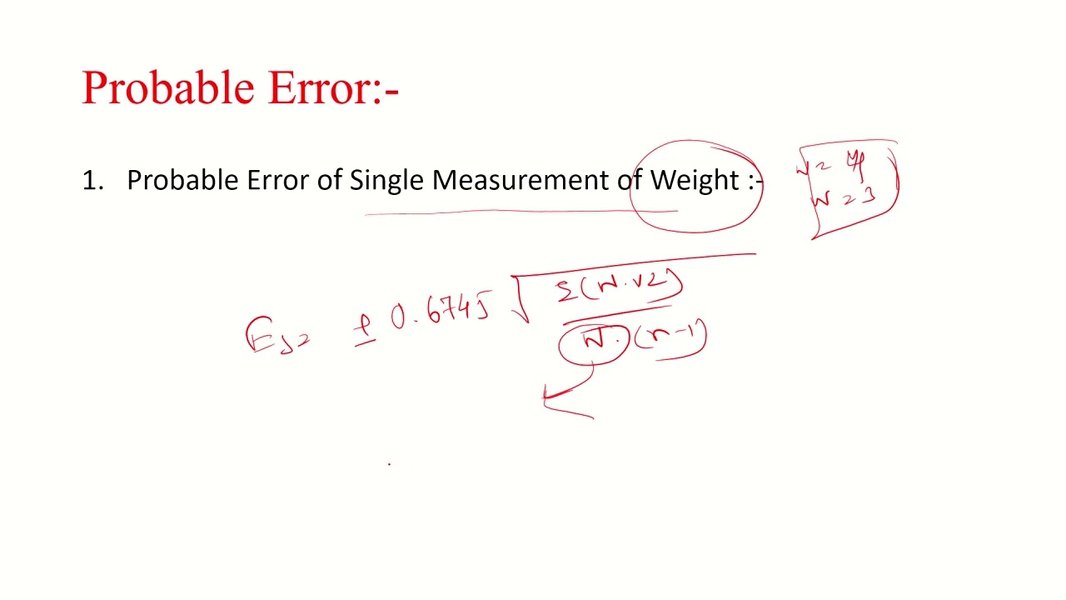
Probable error concepts applied in engineering contexts like Geomatics.
Historical and Niche Uses
Probable error has historical significance, used in early scientific work (e.g., astronomy in the 18th and 19th centuries) to express uncertainty before modern statistical methods like standard error and confidence intervals became widespread. It also remains theoretically useful as a scale parameter for certain statistical distributions, like the Cauchy distribution, which notably lacks a defined mean and standard deviation.
Comparing Probable Error to Other Statistical Measures
Understanding how Probable Error differs from related concepts like Standard Error and Confidence Intervals is crucial for its correct interpretation.
Probable Error vs. Standard Error (SE)
- Probable Error (PE): Measures the range around a sample statistic (like the mean) within which the true population parameter has a 50% chance of lying. It's a direct measure of uncertainty based on a 50% probability threshold.
- Standard Error (SE): Measures the standard deviation of the sampling distribution of a statistic. It quantifies how much sample statistics (like the sample mean) are expected to vary from sample to sample. SE is used to calculate confidence intervals at various levels (e.g., 95%, 99%) and perform hypothesis testing.
While both relate to estimation error, PE provides a specific 50% bound, whereas SE is a more general measure of sampling variability used to construct intervals of varying confidence levels.
Probable Error vs. Confidence Intervals
- Probable Error (PE): Corresponds directly to the half-width of a 50% confidence interval for the mean of a normal distribution (Mean ± PE).
- Confidence Intervals (CI): Provide a range (e.g., Mean ± Margin of Error) within which the true population parameter is estimated to lie with a specified level of confidence (e.g., 95%, 99%). The margin of error in a CI is typically calculated using the standard error and a critical value (like a z-score or t-score) corresponding to the desired confidence level.
A 95% confidence interval (often ≈ Mean ± 2 * SE for large samples) is much wider than the range defined by the Probable Error (Mean ± PE ≈ Mean ± 0.6745 * σ) because it aims to capture the true value with much higher probability (95% vs. 50%).
Interactive Exploration: Key Factors Influencing Probable Error
The relevance and interpretation of Probable Error can depend on several factors. The radar chart below illustrates the relative importance of different factors in two hypothetical scenarios where Probable Error might be considered.
This chart visualizes how factors like the need for precision, adherence to data normality assumptions, the impact of sample size, the strength of correlation being assessed, and the degree of measurement variability might influence the applicability or interpretation of Probable Error. For instance, in Scenario 1 (e.g., high-precision measurement control), factors like 'Measurement Precision Required' and 'Measurement Variability' might be highly critical. In Scenario 2 (e.g., initial correlation assessment), 'Correlation Strength Assessment' and 'Sample Size Influence' could be more dominant.
Mindmap: Understanding the Ecosystem of Probable Error
This mindmap provides a visual overview of the key concepts related to Probable Error, including its definition, calculation methods, primary applications, and how it compares to other statistical measures.
PE ≈ 0.6745 * σ"] id2b["For Correlation (r):
PE_r = (0.6745 * (1 - r²)) / √n"] id2c["From Inverse Error Function"] id3["Applications"] id3a["Correlation Analysis"] id3a1["Assess significance (r > 6*PE rule)"] id3a2["Determine probable limits (r ± PE_r)"] id3b["Measurement Systems Analysis (MSA/Gage R&R)"] id3b1["Define effective measurement increments"] id3b2["Assess process consistency"] id3b3["Quality Control"] id3c["Historical Context"] id3c1["Early scientific uncertainty expression"] id3d["Niche Distributions (e.g., Cauchy)"] id3d1["Scale parameter when σ undefined"] id4["Comparison"] id4a["vs. Standard Deviation (σ)"] id4a1["PE focuses on central 50%"] id4a2["σ measures overall spread (approx. 68% in ±1σ)"] id4b["vs. Standard Error (SE)"] id4b1["PE is 50% probability bound"] id4b2["SE measures sampling distribution std dev"] id4b3["SE used for general CIs"] id4c["vs. Confidence Intervals (CI)"] id4c1["PE = half-width of 50% CI"] id4c2["CIs use SE for various confidence levels (95%, 99%)"]
Visual Learning: Probable Error Explained
For an auditory and visual explanation, this video discusses the concepts of Standard Error and Probable Error, highlighting their roles in statistics, particularly concerning reliability and dependability of correlation values.
Probable Error in Different Scenarios (Illustrative Table)
The calculation and interpretation of Probable Error can vary depending on the context. This table provides illustrative examples of how PE might be applied or considered in different situations.
| Scenario | Data Characteristics / Context | Probable Error Interpretation / Calculation Note |
|---|---|---|
| Estimating a Mean | Sample data roughly follows a normal distribution; Standard Deviation (σ) is known or estimated. | PE ≈ 0.6745 × σ. Defines the range (Mean ± PE) with a 50% chance of containing the true population mean. |
| Correlation Analysis | Correlation coefficient (r) calculated from a sample of size (n). E.g., r = 0.8, n = 25. | Calculate PEr = (0.6745 * (1 - 0.8²)) / √25 ≈ 0.0486. Since |0.8| > 6 * 0.0486 (0.8 > 0.2916), the correlation is likely significant. Probable limits are 0.8 ± 0.0486 (0.7514 to 0.8486). |
| Measurement Control | Repeated measurements of a standard part show a standard deviation (σ) of 0.02 mm. Process assumed stable (normal variation). | PE ≈ 0.6745 × 0.02 mm ≈ 0.0135 mm. Differences between consecutive measurements less than ≈0.0135 mm might be attributed to random error within the 50% probability range. Helps define instrument resolution needs. |
| Non-Normal Data | Data follows a Cauchy distribution (no defined mean or standard deviation). | PE can still be used as a robust measure of scale or spread, often calculated directly from the quantiles (half the interquartile range). The 0.6745*σ formula does not apply. |
Frequently Asked Questions (FAQ)
What is the main difference between probable error and standard deviation?
Probable Error (PE) defines the range around a central value within which 50% of the data (or errors) are expected to fall. Standard Deviation (σ) measures the typical or average distance of data points from the mean, encompassing about 68% of the data within ±1σ for a normal distribution. PE is specifically tied to the 50% probability mark, while σ gives a broader sense of overall spread.
When is probable error most useful?
PE is particularly useful in specific contexts like:
- Quickly assessing the significance of a correlation coefficient using the '6 times PE' rule.
- Evaluating the precision and defining effective increments in measurement systems (quality control, Gage R&R).
- Situations where a 50% confidence boundary is specifically desired or easily interpretable.
- Analyzing distributions (like Cauchy) where standard deviation isn't defined.
How is probable error calculated for a correlation coefficient?
The probable error for a Pearson correlation coefficient (r) based on a sample size (n) is calculated using the formula:
\[ \text{PE}_r = \frac{0.6745 \times (1 - r^2)}{\sqrt{n}} \]This value helps determine if the observed correlation 'r' is likely real or just due to sampling fluctuations.
Is probable error still commonly used today?
While historically significant, Probable Error is less commonly used in general statistical reporting today compared to standard error and confidence intervals (typically 95% CIs). However, it retains its utility in specific fields like measurement systems analysis and as a quick check for correlation significance taught in some statistics courses.
What does it mean if a value falls outside the probable error range?
If a measured value or error falls outside the Mean ± PE range, it means it's in the outer 50% of the expected distribution (assuming symmetry). It represents a larger deviation from the central value than is typical for half of the observations. While not necessarily an outlier, it indicates a deviation that occurs with less than 50% probability on either side.
Recommended Further Exploration
- How does probable error relate to confidence intervals of different levels?
- Can you show a step-by-step calculation of probable error for a correlation coefficient?
- How is probable error specifically used in Gage R&R (Repeatability and Reproducibility) studies?
- What are the key differences and use cases for probable error, standard error, and standard deviation?
References
Last updated May 1, 2025