
Beyond Numbers: The Complex Tapestry of U.S.-China Trade Relations
A data-driven exploration of the world's most significant bilateral trade relationship and its far-reaching economic implications
Key Insights from U.S.-China Trade Flow Analysis
- Substantial Trade Imbalance: The U.S. imported $462.62 billion in goods from China in 2024, while China imported only $143.5 billion from the U.S., creating a $319.12 billion trade deficit.
- Divergent Trade Compositions: U.S. imports from China are dominated by manufactured consumer goods (electronics 29.5%, machinery 18.1%), while U.S. exports to China are primarily agricultural products, aircraft, and specialized machinery.
- Escalating Tariff Tensions: Recent policy developments, including China's 34% tariff on U.S. goods announced in April 2025, threaten to significantly alter established trade patterns and supply chains.
Overview of the U.S.-China Trade Relationship
The United States and China maintain the world's largest bilateral trade relationship, characterized by significant interdependence and growing tensions. As of 2024, total goods trade between the two nations reached $582.4 billion, with China serving as the primary source of U.S. imports and a substantial market for U.S. exports.
This economic relationship is asymmetrical, with U.S. imports from China consistently outpacing exports to China. This disparity has fueled ongoing policy debates about trade balances, market access, and competitive practices. Understanding the composition and trends of these trade flows provides crucial insights into global economic dynamics and potential future developments.
Historical Context of U.S.-China Trade Relations
The trade relationship between the U.S. and China has evolved dramatically since China's economic opening in the late 1970s. Trade volumes expanded exponentially following China's 2001 entrance into the World Trade Organization, fundamentally reshaping global supply chains and manufacturing patterns. Recent years have seen growing tensions as both nations have implemented tariffs and other trade restrictions, with economic competition increasingly intertwined with geopolitical considerations.
U.S. Imports from China: Composition and Trends
In 2024, U.S. imports from China totaled $462.62 billion, representing a 2.8% increase from 2023. China remains the largest source of U.S. imported goods, accounting for a substantial portion of consumer products found in American households.
Major Categories of U.S. Imports from China
U.S. imports from China span diverse product categories, though they are predominantly manufactured goods. The composition highlights China's manufacturing strength and its critical position in global supply chains.
Leading Product Categories by Value
| Product Category | Value (Billion USD) | Percentage of Total | Year-Over-Year Change |
|---|---|---|---|
| Electronics | $136.8 | 29.5% | +3.2% |
| Machinery | $83.8 | 18.1% | +1.8% |
| Furniture and Bedding | $34.6 | 7.5% | +0.9% |
| Apparel and Accessories | $31.8 | 6.9% | -2.3% |
| Footwear | $24.8 | 5.4% | -1.2% |
| Toys and Sports Equipment | $22.5 | 4.9% | +2.6% |
| Plastics | $19.4 | 4.2% | +3.4% |
| Other Categories | $109.0 | 23.5% | Varied |
Geographic Distribution within the U.S.
Imports from China are not evenly distributed across the United States. Certain states exhibit significantly higher dependence on Chinese goods, reflecting regional economic specializations and supply chain structures. Nevada, California, and Washington D.C. show particularly high reliance on imports from China, often driven by specific industry concentrations in these regions.
Recent Trends in U.S. Imports from China
Despite trade tensions and pandemic-related disruptions, U.S. imports from China have shown resilience. After a temporary decline during the initial COVID-19 outbreak, import volumes rebounded and continued to grow through 2024. However, early 2025 data suggests a potential downturn, with January-February figures showing a 15.6% decrease compared to the same period in 2024, likely influenced by new tariff policies and ongoing supply chain diversification efforts.
The radar chart above compares the relative strengths of Chinese exports to the U.S., U.S. exports to China, and U.S. domestic production across various competitive factors. China's exports demonstrate particular advantages in manufacturing scale, labor cost efficiency, and production speed, while U.S. products excel in innovation capacity and quality control. These complementary strengths help explain the persistence of trade patterns despite policy interventions.
Chinese Imports from the U.S.: Composition and Trends
In 2024, Chinese imports from the U.S. amounted to $143.5 billion, representing a 2.9% decrease from 2023. While this figure is substantially lower than U.S. imports from China, it represents a crucial market for specific U.S. industries.
Major Categories of Chinese Imports from the U.S.
The composition of Chinese imports from the U.S. differs markedly from the reverse flow, featuring more agricultural products, high-technology items, and specialized inputs. This pattern reflects comparative advantages and strategic trade considerations.
Leading Product Categories by Value
Chinese imports from the U.S. are concentrated in several key sectors, with particular strength in agricultural commodities, advanced technology, and energy products. Based on the most recent complete year data (2023):
- Electrical Machinery: $15.3 billion (9.3%)
- Fuels: $14.7 billion (8.9%)
- Soybeans: $13.4 billion (8.1%)
- Oilseeds and Grains: $13.4 billion (8.1%)
- Aerospace and Defense: $10.3 billion (6.2%)
- Semiconductors and Components: $9.8 billion (5.9%)
- Medical Equipment: $8.6 billion (5.2%)
- Automobiles and Parts: $7.9 billion (4.8%)
Recent Trends in Chinese Imports from the U.S.
Chinese imports from the U.S. have fluctuated significantly in recent years, influenced by trade disputes, strategic priorities, and economic conditions. Agricultural products, particularly soybeans, have experienced volatility due to tariff policies and alternative sourcing. High-technology exports have faced increasing restrictions due to national security considerations, while energy exports have grown as China diversifies its supply sources.
Impact of Recent Policy Developments
The announcement in April 2025 of a 34% tariff on U.S. goods by China marks a significant escalation in trade tensions. Early indicators suggest this could result in a substantial reduction in Chinese imports from the U.S., particularly affecting agricultural products, energy resources, and certain technology sectors. Strategic and essential imports may be less affected due to limited alternative sources.
Visualizing the U.S.-China Trade Relationship
Key Elements of the Bilateral Trade Structure
The following mindmap illustrates the complex and multifaceted nature of the U.S.-China trade relationship, highlighting key components, influences, and stakeholders involved in this economic interchange.
Historical Trade Balance Visualization
The historical trade balance between the U.S. and China reveals persistent imbalances that have shaped policy discussions and economic strategies. While China has maintained a significant trade surplus with the U.S. for decades, the magnitude has fluctuated in response to economic cycles, policy interventions, and structural changes in both economies.
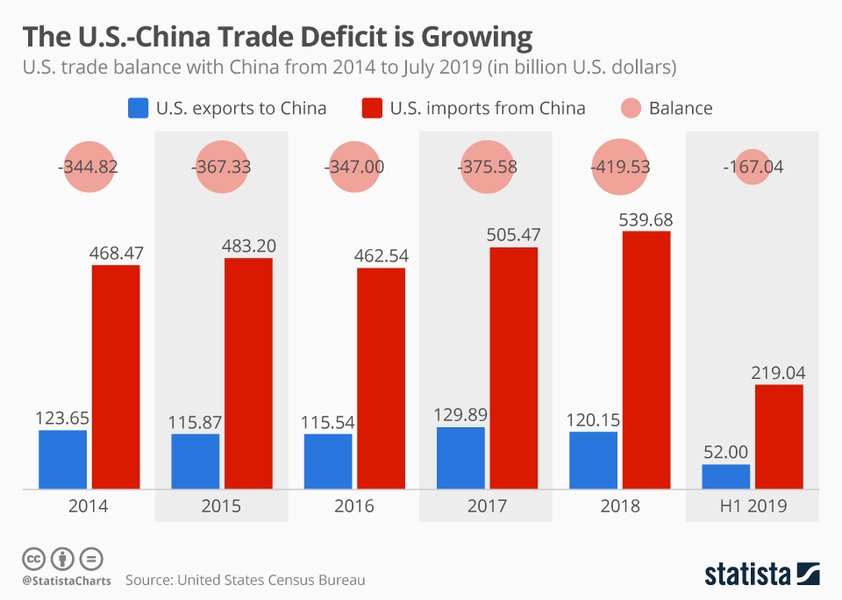
The chart above from Statista visually demonstrates the growing U.S. trade deficit with China over time. This persistent imbalance has been a central point of contention in bilateral economic relations and has motivated numerous policy interventions aimed at addressing perceived inequities in market access and competitive practices.
Impact of Recent Trade Policies and Tariffs
Trade relations between the U.S. and China have been significantly reshaped by policy interventions over the past several years. Tariffs, export controls, and investment restrictions have altered trade flows, increased costs, and accelerated supply chain diversification efforts.
Tariff Impacts on Trade Volumes
The implementation of tariffs by both countries has resulted in observable changes to trade patterns, though the magnitude has varied by sector. Some key effects include:
- Reduced trade volumes in targeted categories, with import substitution or sourcing diversification
- Increased costs for businesses and consumers in both countries
- Accelerated relocation of manufacturing facilities to third countries
- Adaptation strategies including transshipment and supply chain restructuring
Strategic Trade Restrictions
Beyond tariffs, both nations have implemented targeted restrictions on technology transfers, investments, and strategic goods. The U.S. has introduced export controls on advanced semiconductors and semiconductor equipment, while China has implemented policies to reduce dependence on foreign technologies. These measures reflect the growing intersection of economic and national security considerations in the bilateral relationship.
The video above examines China's record-high trade figures and growing trade surplus with the U.S., highlighting the complex dynamics at play despite trade tensions. It explores how trade patterns have evolved despite policy interventions and how both economies continue to maintain significant interdependence even as they pursue greater self-sufficiency in strategic sectors.
Future Outlook and Strategic Considerations
The U.S.-China trade relationship is likely to continue evolving in response to economic, technological, and geopolitical factors. Several key trends will shape future developments:
Supply Chain Resilience and Diversification
Both countries are pursuing strategies to enhance supply chain resilience, though with different approaches. U.S. policies increasingly emphasize "friend-shoring" to trusted partners, while China's dual circulation strategy seeks to reduce external dependencies while maintaining export markets. These parallel efforts will gradually reshape trade flows, though complete decoupling remains unlikely due to the depth of existing integration.
Technology Competition and Cooperation
The technology sector will remain a focal point of both competition and selective cooperation. Strategic technologies like semiconductors, artificial intelligence, and clean energy will face increasing restrictions, while opportunities for collaboration may persist in addressing global challenges like climate change.
Economic Interdependence Despite Tensions
Despite growing tensions, economic interdependence will remain a defining feature of the relationship. The sheer scale of bilateral trade, established supply chains, and complementary economic strengths create powerful incentives for maintaining commercial ties even as strategic competition intensifies in specific domains.
Frequently Asked Questions
References
- U.S.-China Trade Facts - Office of the United States Trade Representative
- China Trade Statistics - World Integrated Trade Solution
- U.S. Trade Deficit with China 2024 - Statista
- United States Imports from China - Trading Economics
- China Imports from United States - Trading Economics
- Value of U.S. monthly imports from China 2025 - Statista
-
China strikes back at Trump with own tariffs, export curbs - Reuters
Recommended Searches
Last updated April 9, 2025