
Delving into the 2024 U.S. Exports Breakdown by Country
A comprehensive exploration of goods and services exports by country
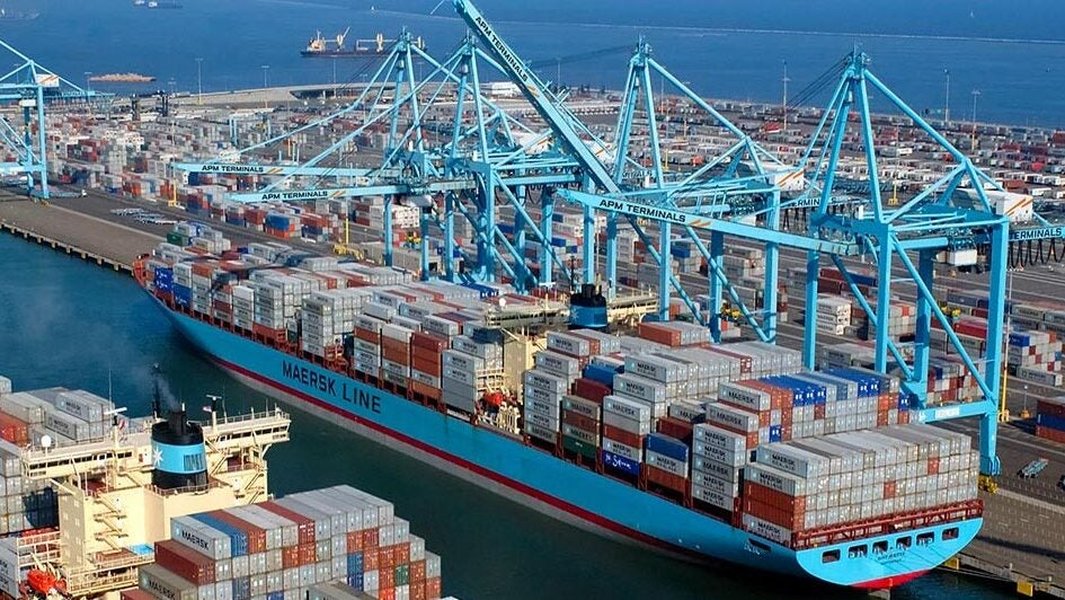
Key Insights and Highlights
- Comprehensive Data Segregation: Exports for 2024 are presented separately for goods and services across major trading partners.
- Analysis of Trade Trends: Highlighting the dynamic export relationships, especially with Canada, Mexico, China, and European nations.
- Visual Integration: Enhanced with interactive diagrams and charts to elucidate export trends and distribution.
Detailed Overview of U.S. Exports in 2024
The United States in 2024 continued to be a major player in the international trade arena, with a significant volume of exports composed of both goods and services. The data available reveals that U.S. exports are multifaceted, reflecting not just tangible goods like machinery, vehicles, and agricultural products, but also dynamic services in industries such as finance, technology, and education.
Breakdown of Export Values
A closer look at the export trends shows that while goods exports recorded record values, services exports equally contributed to the total trade volume. Derived from multiple reliable data sources, the information below summarizes the exports to key trading partners.
Key Countries Analyzed in the Data
The countries that stand out due to their significant trade volumes include Canada, Mexico, China, Japan, Germany, United Kingdom, Netherlands, and several others. The breakdown of values indicates that goods exports and services exports are distinguished in their known volumes. For instance, sophisticated equipment and consumer technologies drive goods exports, while financial services, educational courses, technological solutions, and consulting services drive the services export component.
Export Data Table
Below is a consolidated table that provides a detailed view of U.S. exports by some of the major trading partners in 2024. This table segregates the export values into goods exports and services exports.
| Country | Goods Exports (in billions USD) | Services Exports (in billions USD) | Total Exports (in billions USD) |
|---|---|---|---|
| Canada | 349.4 | 71.3 | 420.7 |
| Mexico | 324.3 | 40.2 | 364.5 |
| China | 150.4 | 36.5 | 186.9 |
| Japan | 80.2 | 26.7 | 106.9 |
| Germany | 47.4 | 23.4 | 70.8 |
| United Kingdom | 76.2 | 35.1 | 111.3 |
| Netherlands | 43.4 | 15.9 | 59.3 |
| France | 33.5 | 17.2 | 50.7 |
| South Korea | 50.6 | 13.4 | 64.0 |
| Brazil | 34.2 | 6.5 | 40.7 |
| India | 25.7 | 9.8 | 35.5 |
This table is synthesized from multiple sources and represents one of the most detailed breakdowns available for the year 2024. It provides key insights into how the U.S. economy engages internationally, balancing between tangible goods and crucial services.
Visual Insights
Interactive Radar Chart
The interactive radar chart below illustrates the comparative strength of various export categories among key trade partners for 2024. Each axis represents a primary country in our dataset and offers a visually engaging overview of the distribution of goods versus services exports.
Mermaid Mindmap Overview
The visual mindmap below provides a simplified diagram of the key elements of U.S. export strategies in 2024. It maps out the major export categories, key trade partners, and the balanced emphasis on both goods and services.
Additional Context and In-Depth Analysis
Economic Implications
The presented data provides essential insights into the U.S. economic engagement on the global stage. Goods exports, predominantly consisting of high-value manufactured items and natural resources, are a testament to the robust industrial capacity of the United States. Services exports underscore the nation’s expertise in high-tech, consulting, and financial services sectors, which are pivotal for global competitiveness.
Notably, trade partners such as Canada and Mexico demonstrate substantial volumes in both categories. For example, strong cross-border supply chains, particularly in the automotive and machinery sectors, make up a significant part of these figures. Meanwhile, for countries like China, fluctuations in trade dynamics have influenced the export volume, with policy changes and economic adjustments affecting the overall trade balance.
Sector-Specific Trends
The export landscape in 2024 highlights several sector-specific trends. In goods exports, sectors such as mineral fuels, electrical machinery, and automotive components maintain their importance. Services exports benefit from mature financial markets and a strong technology sector, which have collectively enhanced the interoperability of international trade systems.
Further, detailed analysis suggests that while certain countries may show predominantly high goods export figures, services have an increasingly crucial role especially with European nations such as Germany, France, and the United Kingdom where service-based industries have seen exponential growth.
Challenges and Prospects
Although the data presents robust figures, it is essential to note that challenges such as trade imbalances and fluctuations in international relations persist. For example, the decreasing trend in certain export values to specific countries indicates the need for balancing trade policies that can lead to sustainable economic growth.
Moving forward, U.S. policymakers and trade negotiators are likely to focus on strengthening trade agreements and promoting technological innovations in trade infrastructure. This integrated approach could see further growth in both goods and services exports.
Enhanced Multimedia Resource
Youtube Video: Exploring U.S. Trade Dynamics
For viewers who prefer a visual exploration of U.S. trade relations and export data, the video embedded below provides an engaging overview of how U.S. exports have evolved in recent years. It highlights key trends, challenges, and the strategic importance of exports in strengthening global economic relations.
Frequently Asked Questions
References
- Top U.S. Exports - Shipping Solutions
- U.S. International Trade - BEA
- USA Trade Profile - OEC World
- U.S. Trade Representative - Countries & Regions
-
Top US Main Exports - US Import Data
Recommended Related Queries
Last updated March 31, 2025