
Unveiling Efficiency: A Comprehensive Guide to Value Stream Mapping
Discover how VSM helps visualize, analyze, and optimize your processes for maximum value delivery.
Key Highlights of Value Stream Mapping
- Visualizing the Flow: VSM provides a clear, visual representation of all steps involved in delivering a product or service, from beginning to end.
- Identifying and Eliminating Waste: A primary goal of VSM is to pinpoint non-value-adding activities and inefficiencies, enabling streamlined processes.
- Enhancing Continuous Improvement: By creating both current and future state maps, VSM acts as a blueprint for ongoing process optimization and lean transformation.
What is Value Stream Mapping?
Value Stream Mapping (VSM) is a powerful lean management technique used to visualize, analyze, and improve the flow of materials and information required to bring a product or service to a customer. Essentially, it's a detailed diagram that maps out every step in a process, highlighting both value-adding and non-value-adding activities from the customer's perspective. This visual tool provides a comprehensive understanding of a process, making it easier to identify bottlenecks, waste, and areas for improvement.
Originating from lean manufacturing, notably the Toyota Production System (which referred to it as material and information flow diagramming), VSM has since been widely adopted across various industries, including logistics, supply chain management, healthcare, software development (DevOps), product development, project management, and administrative processes. The core principle remains the same: to understand the end-to-end flow of value and identify opportunities to make the process more efficient and effective.
Unlike simple process maps that focus solely on the sequence of steps, VSM goes deeper by quantifying aspects like cycle times, lead times, inventory levels, and the amount of time spent on value-adding versus non-value-adding activities. This data-driven approach allows teams to gain a more complete and multidimensional picture of how well a process is flowing and where inefficiencies lie.
The Purpose and Goals of Value Stream Mapping
The primary purpose of Value Stream Mapping is to identify and eliminate waste within a process. Waste, in the context of VSM and lean methodologies, refers to any activity that consumes resources but does not add value from the customer's point of view. By visually mapping the entire value stream, teams can clearly see where these non-value-adding steps occur, such as delays, excess inventory, unnecessary movement, or defects.
The goals of implementing VSM include:
- Identifying and reducing various forms of waste (e.g., overproduction, waiting, transport, overprocessing, inventory, motion, defects).
- Reducing process cycle times and lead times, leading to faster delivery of products or services.
- Improving process efficiency and productivity.
- Enhancing communication and collaboration among team members and across different departments involved in the value stream.
- Creating a shared understanding of the current state of a process.
- Developing a vision for an improved future state process.
- Supporting continuous improvement initiatives by providing a roadmap for transformation.
- Ultimately, increasing customer satisfaction by delivering higher quality products or services more quickly and efficiently.
By focusing on the entire flow of value, VSM encourages a holistic view of operations, rather than optimizing individual steps in isolation. This often reveals significant opportunities for improvement that might otherwise be overlooked.
Creating a Value Stream Map: A Step-by-Step Approach
Creating a Value Stream Map is a team-based activity that typically involves individuals who are directly involved in or have a deep understanding of the process being mapped. The process generally follows these steps:
1. Identify the Product Family or Service
Begin by defining the specific product or service that will be the focus of the value stream map. It's often helpful to group similar products or services that follow a similar processing path into "product families."
2. Define the Scope and Boundaries
Determine the starting and ending points of the value stream you will be mapping. This could be from raw material to delivered product, or from customer order to service delivery.
3. Draw the Current State Map
This is the core of the VSM process. The team walks through the actual process, observing and collecting data on each step. Standard VSM symbols are used to represent different elements of the value stream, such as:
Process Boxes:
Representing individual process steps or departments.Inventory Triangles:
Indicating points where inventory builds up between processes.Arrows:
Depicting the flow of materials and information.Data Boxes:
Recording key metrics for each process step, such as cycle time, lead time, changeover time, and first-pass yield.Information Flow:
Represented by dashed arrows, showing how information is communicated between steps.
The current state map should accurately reflect how the process currently operates, not how it is *supposed* to operate.
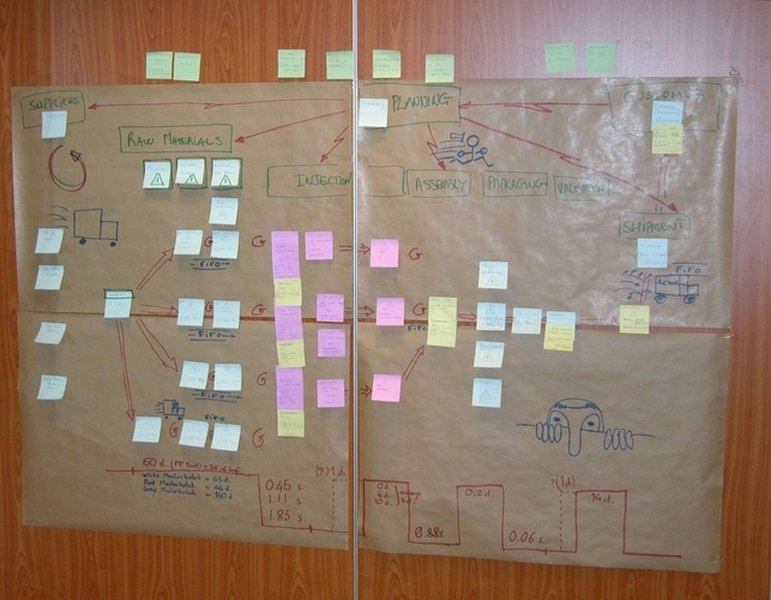
An example illustrating the visual elements in a Value Stream Map.
4. Analyze the Current State Map
Once the current state map is complete, the team analyzes the data collected to identify areas of waste, bottlenecks, and constraints. Key questions to ask include:
- Where are the major delays or wait times?
- Where does inventory accumulate?
- Are there unnecessary steps in the process?
- Where do defects occur?
- How efficiently is information flowing?
- What is the ratio of value-adding time to total lead time?
5. Design the Future State Map
Based on the analysis of the current state, the team brainstorms and designs an ideal future state map. This map represents how the process should operate after improvements have been implemented. The future state map should aim to eliminate or significantly reduce the identified waste and bottlenecks.
6. Develop an Action Plan
The final step is to develop a detailed action plan outlining the specific steps required to move from the current state to the future state. This plan should include timelines, responsibilities, and metrics for measuring progress.
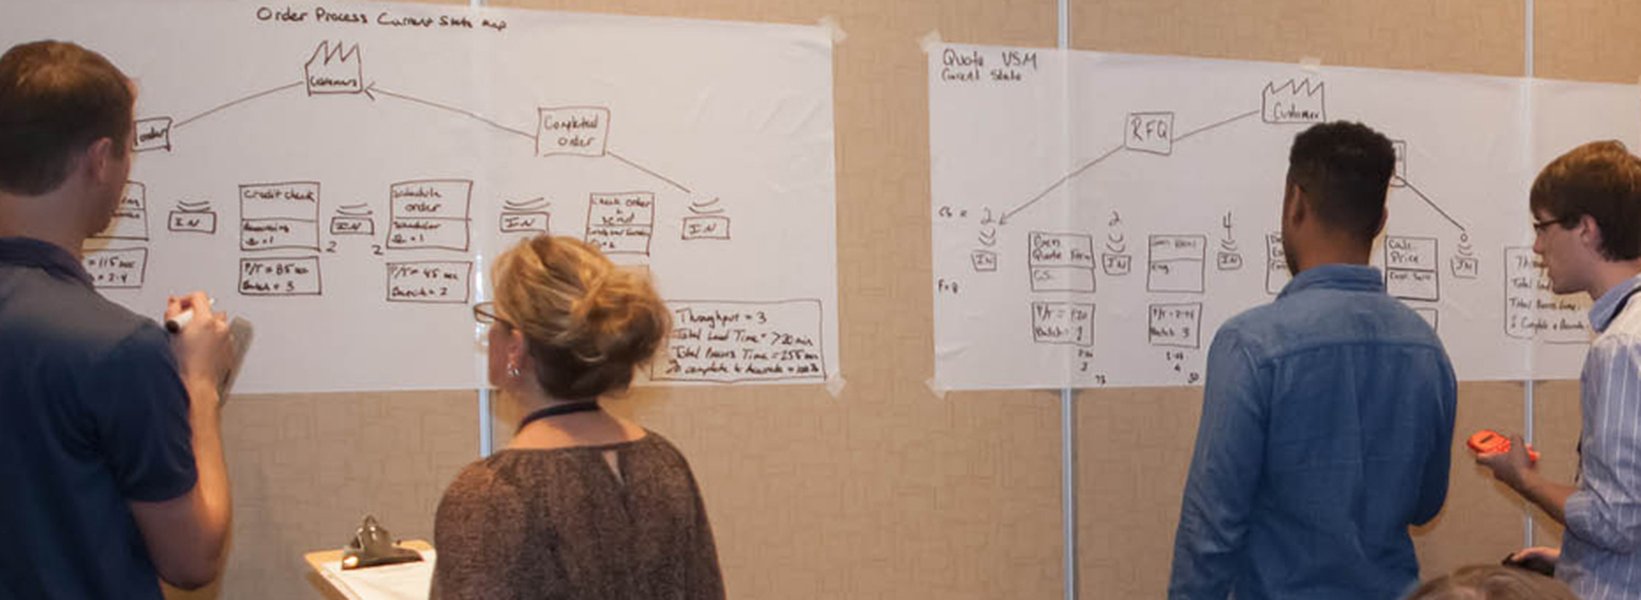
Teams often collaborate in workshops to create Value Stream Maps.
Benefits of Value Stream Mapping
Implementing Value Stream Mapping can bring numerous benefits to an organization, leading to improved performance and competitiveness. Some of the key benefits include:
-
Improved Efficiency and Productivity:
By identifying and eliminating waste, VSM streamlines processes and reduces non-value-adding activities, leading to increased efficiency and output. -
Reduced Lead Times:
VSM helps to shorten the time it takes for a product or service to flow through the process from start to finish, resulting in faster delivery to the customer. -
Cost Reduction:
Eliminating waste, reducing inventory, and improving efficiency all contribute to lower operational costs. -
Improved Quality:
By identifying the root causes of defects and implementing improvements, VSM can lead to a reduction in errors and rework, resulting in higher quality products or services. -
Enhanced Communication and Collaboration:
The process of creating a VSM brings together individuals from different parts of the value stream, fostering better understanding and teamwork. -
Better Decision-Making:
VSM provides a data-driven view of the process, enabling more informed decisions about where to focus improvement efforts. -
Support for Continuous Improvement:
VSM is a foundational tool for lean and continuous improvement initiatives, providing a clear roadmap for ongoing optimization. -
Increased Customer Satisfaction:
Faster delivery, improved quality, and more efficient processes ultimately lead to a better customer experience.
Value Stream Mapping in Different Industries
While rooted in manufacturing, the principles and benefits of Value Stream Mapping are applicable to a wide range of industries and processes. The focus remains on identifying the flow of value and eliminating waste, but the specific steps and types of waste may differ.
Here are some examples of how VSM is applied in different sectors:
Manufacturing
In manufacturing, VSM traditionally focuses on the flow of raw materials through production steps to the finished product. Waste in manufacturing can include excess inventory, machine downtime, defects, and unnecessary movement of materials or people.
Software Development (DevOps)
In the context of software development and DevOps, VSM maps the flow of work from the initial idea or requirement through coding, testing, deployment, and delivery to the customer. Waste in this context often involves handoffs between teams, waiting times for approvals or infrastructure, rework due to bugs, and inefficient communication.
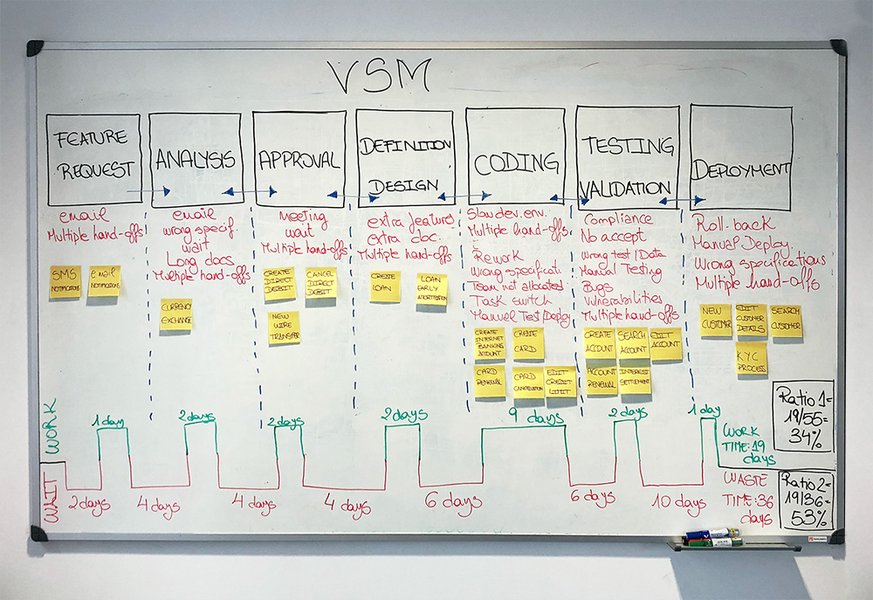
Value Stream Mapping applied to a DevOps workflow.
Healthcare
In healthcare, VSM can be used to map patient journeys, administrative processes, or clinical workflows. The goal is to improve patient care, reduce waiting times, eliminate unnecessary steps, and optimize the use of resources. Waste in healthcare might include delays in diagnosis or treatment, redundant paperwork, and inefficient scheduling.
Service Industries
Service industries can utilize VSM to map the steps involved in delivering a service to a customer, such as processing an insurance claim, onboarding a new client, or resolving a customer complaint. Waste in service processes could include excessive approval layers, redundant data entry, and unclear communication with the customer.
Regardless of the industry, the fundamental principles of VSM remain consistent: visualize the flow, identify waste, and create a plan for improvement.
Distinguishing Value Stream Mapping from Process Mapping
While both Value Stream Mapping and Process Mapping are visual tools used to understand workflows, they have distinct differences:
| Feature | Value Stream Mapping (VSM) | Process Mapping |
|---|---|---|
| Focus | Entire value stream from customer request to delivery, emphasizing the flow of materials and information and identifying waste. | Detailed steps within a specific process. |
| Scope | Typically covers multiple departments or functions involved in delivering value to the customer. | Usually focuses on a single process within a department or function. |
| Metrics | Includes quantitative data such as cycle times, lead times, inventory levels, and value-adding vs. non-value-adding time. | Primarily focuses on the sequence of steps and decision points. |
| Goal | Identify and eliminate waste across the entire value stream to improve overall flow and efficiency. | Document and understand the steps of a specific process, often to identify bottlenecks or areas for improvement within that process. |
| Perspective | Customer-centric, focusing on what adds value from the customer's point of view. | Often internally focused on how a specific process operates. |
VSM provides a higher-level, end-to-end view of the process and is specifically designed to highlight opportunities for waste reduction and flow improvement across the entire value stream. Process mapping, on the other hand, is useful for understanding the detailed steps of a particular process.
The Role of VSM in Continuous Improvement
Value Stream Mapping is a fundamental tool for organizations committed to continuous improvement and lean principles. By providing a clear visual representation of the current state and a target for the future state, VSM acts as a roadmap for implementing changes and monitoring their impact.
The iterative nature of VSM, where teams repeatedly map the current state and design future states, helps to embed a culture of continuous improvement. It encourages teams to constantly seek out and eliminate waste, optimize processes, and improve the flow of value to the customer.
VSM also facilitates communication and collaboration, which are essential for successful continuous improvement initiatives. When individuals from different parts of the value stream work together to create and analyze the map, they gain a shared understanding of the challenges and opportunities, fostering a more collaborative approach to problem-solving.
Visualizing Value Stream Mapping
To further illustrate the concept of Value Stream Mapping, here is a video providing a basic introduction:
This video helps explain the fundamental concepts and benefits of VSM in a clear and concise manner.
Frequently Asked Questions about Value Stream Mapping
What are the key metrics to capture in a Value Stream Map?
Key metrics typically include cycle time (the time it takes to complete one unit of work at a process step), lead time (the total time it takes for a unit to travel through the entire value stream), processing time (the actual time spent working on a unit), changeover time (time to switch between different products or tasks), and first-pass yield (the percentage of units that pass through a step without requiring rework).
How often should Value Stream Maps be updated?
The frequency of updating VSMs depends on the complexity of the process and the pace of change within the organization. For processes undergoing significant changes or continuous improvement efforts, it's beneficial to revisit and update the map regularly (e.g., every few months). For more stable processes, annual reviews might be sufficient.
Can Value Stream Mapping be applied to administrative processes?
Yes, absolutely. VSM is highly effective for administrative and office processes. The principles of identifying waste and optimizing flow are just as relevant in administrative workflows as they are in manufacturing or software development. Examples include mapping the process for onboarding a new employee, processing invoices, or managing customer inquiries.
What are the common challenges when implementing VSM?
Common challenges include resistance to change, difficulty in collecting accurate data, lack of understanding of VSM principles, insufficient time allocated for mapping and analysis, and a failure to involve the right people in the process. Strong leadership support and effective team collaboration are crucial for overcoming these challenges.
References
Last updated May 9, 2025